 Johan Noble1,2,3*†
 Lara Cabezas1,2
 Aurelie Truffot3,4Lucile Dumolard2
 Thomas Jouve1,2†
 Paolo Malvezzi1†
 Lionel Rostaing1,2†Céline Dard5Philippe Saas2,5†
 Paolo Cravedi3†
 Zuzana Macek-Jilkova2,6†
- 1Nephrology, Hemodialysis Apheresis and Kidney Transplantation, Department, CHU Grenoble Alpes, Grenoble, France
- 2University Grenoble Alpes, CNRS, Inserm, CHU Grenoble Alpes, Institute for Advanced Biosciences, Grenoble, France
- 3Department of Medicine, Translational Transplant Research Center, Icahn School of Medicine at Mount Sinai, New York, NY, United States
- 4Virology Department, University Hospital Grenoble, Grenoble, France
- 5EFS, Recherche et Développement, Grenoble, France
- 6Hepato-Gastroenterology and Digestive Oncology Department, CHU Grenoble Alpes, Grenoble, France
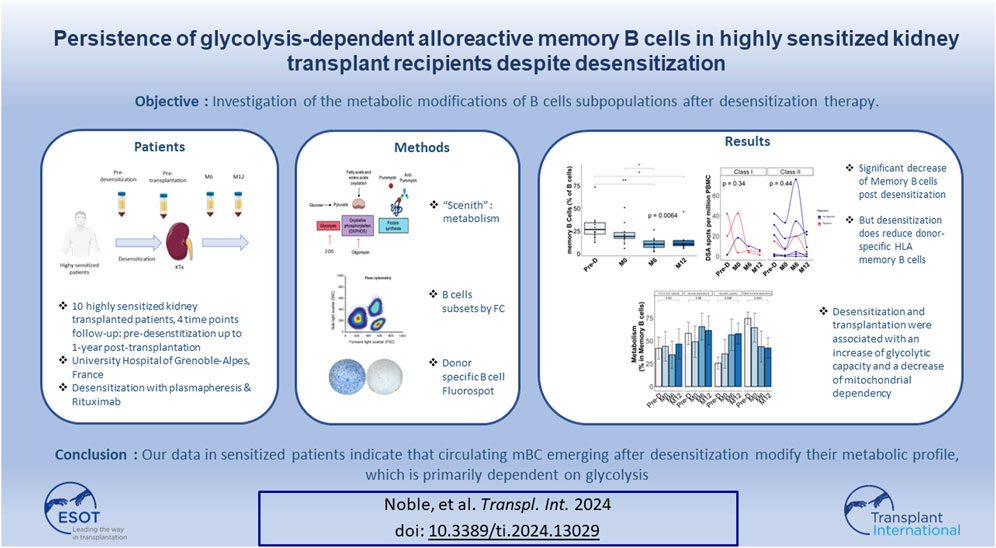
Despite the growing use of desensitization strategies, hyperimmune patients remain at high risk of antibody-mediated rejection suggesting that, even when donor-specific antibodies (DSA) are effectively depleted, anti-donor specific B cells persist. We included 10 highly sensitized recipients that underwent desensitization with plasmapheresis and B cell depletion prior to kidney transplantation. We quantified changes in DSA (luminex), total B-cell subsets (flow cytometry), anti-donor HLA B cells (fluorospot), and single-cell metabolism in serially collected samples before desensitization, at the time of transplant, and at 6 and 12 months thereafter. Desensitization was associated with a decrease in DSA and total memory B cell and naive B cell percentage, while plasma cells and memory anti-donor HLA circulating B cells persisted up to 12 months after transplant. At 12-month post-transplantation, memory B cells increased their glycolytic capacity, while proliferative KI67+ plasma cells modified their metabolism by increasing fatty acid and amino acid oxidation capacity and decreasing their glucose dependence. Despite effective DSA depletion, anti-donor B cells persist in kidney transplant recipients. Due to the reliance of these cells on glycolysis, glycolysis-targeting therapies might represent a valuable treatment strategy.
Introduction
One of the main obstacles to access kidney transplantation (KT) in a context of graft shortage is the presence of anti-human leukocyte antigens (anti-HLA) antibodies. Highly-sensitized patients waiting for a KT represent approximately 10% of the waitlisted individuals and their number is increasing every year [1]. Highly sensitized patient remains on the waiting list longer than non-sensitized patients, despite different national prioritization programs for these patients [2]. This prolonged time on the waiting list and in dialysis is responsible for an increase in patient morbidity and mortality as well as a significant cost to society [3].
To increase the access to transplantation for highly sensitized patients, anti-HLA desensitization may be proposed. Anti-HLA desensitization involves the use of treatments that remove anti-HLA antibodies from plasma and prevent the formation of new anti-HLA antibodies. The most commonly used strategy relies on plasmapheresis and B cell depletion with anti-CD20 monoclonal antibodies (Rituximab) [4–7].
However, despite these techniques that allows KT without hyper-acute rejection, the risk of antibody-mediated rejection (AMR) remains high varying between 15% and 43% depending on the populations, the desensitization techniques, systematic biopsies, and the duration of follow-up [6, 8, 9].
The dynamic changes of B cell compartments, including memory B cells (mBC) after desensitization and post KT are still poorly defined.
Immune cell survival and function are dependent on the adaptability of their metabolism which may be modified by many external factors, including, among many others, inflammation or immunosuppression [10]. Therefore, B cell metabolisms may serve as a surrogate marker for rejection risk. Moreover, metabolic changes of B cells may provide new therapeutic targets to prevent antibody-mediated rejection (AMR) in high-risk patients [11]. This formed the background for the present cohort study aimed at deciphering changes in B cell subsets, including donor-reactive mBCs, and their metabolic profile in highly sensitized kidney transplant recipients undergoing desensitization.
Materials and Methods
Patients and Study Design
In this monocentric study, we included highly sensitized (historical PRA ≥85%) adult patients that received a KT at Grenoble University Hospital, Grenoble, France, between January 2015 and November 2022 post-desensitization therapy. Patients had to be on the KT waiting list for at least 3 years before inclusion, to have no history or ongoing severe infectious or neoplastic disease and to have a satisfying cardiac check-up within the previous 3 months. Peripheral Blood Mononuclear Cells (PBMC) were collected at 4 timepoints: before desensitization, the day of transplantation, at 6-month (M6) post-KT and at 12-month (M12) post-KT (Supplementary Figure S1). Donor-specific antibodies (luminex) were quantified at the same timepoints.
The protocol was approved by investigational review board at Grenoble University Hospital (AC-2019-3627) and by French National committee for data protection (CNIL; approval number 1987785v0). All patients signed written informed consent.
Desensitization Procedure and Post-Transplant Immunosuppression
Desensitization protocol consisted of i) two Rituximab i.v., (375 mg/m2), 2 weeks apart; ii) serial apheresis sessions were performed by immunoadsorption or double-filtration plasmapheresis and a plasma-exchange before the transplantation; iii) oral immunosuppression started the first day of first apheresis. The immunosuppression regimen included prednisone (0.5 mg/kg), mycophenolate mofetil (500 mg x2/day), and tacrolimus (0.1 mg/kg/day, then adapted to an 8–10 ng/mL target trough concentration). Post-transplantation, all recipients received anti-thymocyte globulin induction therapy (1 mg/kg/day for 5 days). Tacrolimus and mycophenolate mofetil were continued post-transplantation and steroids were tapered at 3 months post-transplantation (10 mg/day).
Phenotypic Analysis of B Cell Subpopulations
PBMC were isolated by density gradient centrifugation (Ficoll ®) separation and stored at −120°C before use. After thawing, PBMC were incubated at 37°C between 2 and 4 h to allow them recovering from cryopreservation. Dead cells were stained with LIVE/DEAD™- Yellow LDFixable-575 (BD Biosciences) at room temperature during 15 min. Then, PBMC were stained with the mix of fluorochrome-labelled anti-human antibodies during 20 min at 4°C. The panel included following markers: CD20-BV421, CD38-BV510, CD3-BV650, CD14-BV650, CD24-BV711, CD27-BV786, IgM-BB515 and CD19-APC-R718 (BD Biosciences) antibodies.
After washing, cells were fixed and permeabilized using fixation and permeabilization buffer following manufacturer instructions. Intracellular staining was performed by incubating cells during 30 min at 4°C with intracellular antibodies: Puromycin-AF647 (Merck), Ki67-PE and IgD-BB700 (BD Biociences). Stained cells were then directly analysed using the 4-laser BD FACSymphony A3 flow cytometer, data were analysed by BD FACSDiva™ software (BD Biosciences), FCS Express-7 software and Cytobank. A minimum of one million PBMC of cells were used in each experiment. The gating strategy of B cell subpopulations was shown in Supplementary Figure S2.
Analysis of Cell Metabolism
We used the SCENITH (Single-Cell ENergetIc metabolism by profiling Translation inhibition) technology to assess the metabolic features of B cell subsets at a single cell level [12]. Before antibody staining, PBMC were resuspended in RPMI 10% FCS and were treated during 30 min at 37°C with DMSO (Control), 2DG (100 mM, Sigma), Oligo (1mM, Ozyme), or both (DG + Oligo). Puromycin (Puro, 10 mg/mL, Cayla) was then added during 20 min and cells were washed in cold PBS. The metabolic profiles allowed to distinguish: “glucose dependency” and “mitochondrial dependency” (i.e., the proportion of protein synthesis dependant on glucose and oxidative phosphorylation [OXPHOS], respectively), “glycolytic capacity” showing the maximal capacity of glycolysis to compensate OXPHOS inhibition and “fatty acid and amino acid oxidation (FAO/AAO) capacity” showing FAO/AAO maximal capacity to compensate both glycolysis and OXPHOS inhibition.
HLA Donor Specific B cells
PBMCs were stimulated at a concentration of 1.5 × 10⁶ PBMC/mL [13, 14]. The non-specific stimulation cocktail consisted in recombinant interleukin 2 (IL-2) at 10 ng/mL and R848 (Resquimod) at 1 μg/mL from Mabtech®. After 6 days, cells were added in ELISpot wells at 4.5.106/mL (100 µL) and incubated at 37°C (5% CO2) for 24 h in plate coated with anti-human IgG. Anti-HLA specific IgG-antibody secreting cells were detected using fluorescent dye labeled class I and II HLA dextramers and tetramers to cover at least 1 donor specific HLA corresponding to immunodominant DSA in recipients (PE-tagged B51 dextramers, FITC-labelled dextramer A24, PE-labelled dextramer A2) (Immudex®, Cy5-labelled DR9 tetramers, Cy3-labelled DQ2 tetramers). FluoroSpot enhancer was added during 15 min before reading. Spot quantification was made on IRIS™ reader (Mabtech®). We presented the findings as the proportion of HLA-specific memory B cells (mBC) relative to polyclonal IgG (used as positive controls) for each HLA antigen [15].
IgG Total Secretion by Antibody Secreting Cells Assessed by B Cell ELISpot With Metabolism Blockade
To assess the effect of glycolysis and OXPHOS blockade on IgG secretion by activated mBC, we performed modified ELISpot protocol. We stimulated PBMC with the same non-specific stimulation cocktail IL-2 at 10 ng/mL and R848 at 1 μg/mL (Mabtech®) in addition to 2- DG (100 mM, Sigma), Oligo (1 mM, Ozyme) or both (DG + Oligo). Positive control consisted in Cycloheximide (100 mg/mL, Sigma) and stimulated PBMC cultured without metabolism blockers were used as negative. PBMC were stimulated for 4 days (comparable results versus 6 days, data not shown) and added in the anti-IgG coated wells at 4.5.104/mL (100 µL) and incubated at 37°C (5% CO2) for 24 h. IgG secretion by polyclonal antibody secreting cells was then revealed colorimetrically after addition of Streptavidin-ALP complex and BCIP/NTB-plus substrate.
Statistical Analysis
All numerical data were presented as mean ± standard deviation or median [Q1Q3] according to distribution. All categorical variables were presented as number (percentage). Wilcoxon test was used to compare continuous variables and Fisher exact test was used to compare categorical variables. A two-sided p-value of <0.05 was considered statistically significant and all p-value <0.1 were shown in the figures. To compare the overall differences of subpopulation over time, we first performed an ANOVA. Then we performed two by two analysis between all-time points using t-test after Bonferroni correction. Statistical analyses and figures were conducted using R statistical software® 0.98.932 (Boston, MA, USA). Flow cytometry FCS files were analyzed using Cytobank software [16].
Results
Patients Baseline Characteristics and Outcomes
We included 10 highly sensitized patients (median PRA: 95% [90.5%–97.0%]) that received a KT post-desensitization at the KT department of Grenoble-Alpes (Grenoble, France). Donor and recipient characteristics are presented in Table 1.
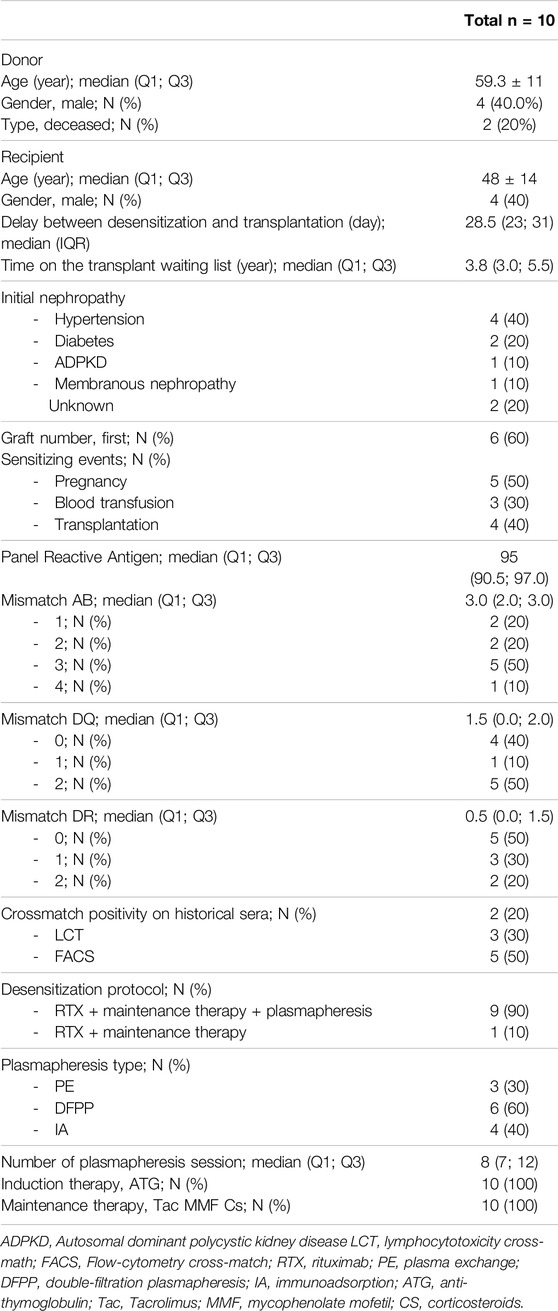
Table 1. Baseline patients’ characteristics.
Before desensitization, mean number of class I DSA was 2.0 ± 1.0 and mean number of class II DSA was 1.4 ± 0.8. The day of KT, mean number of class I DSA was 0.7 ± 1.2 and mean number of class II DSA was 0.6 ± 0.5 (Figures 1A, B). Desensitization therapy was associated with a significant decrease in all DSA MFI and allowed KT with negative crossmatch (Figure 1C). Mean immunodominant MFI (Mean Fluorescence Intensity) for class I DSAs before desensitization was 5,564 ± 5,072 and decreased to 1252 ± 1943 the day of transplantation, p = 0.14 (Figure 1D). Mean immunodominant class II DSA MFI before desensitization was 4629 ± 526 and decreased to 1694 ± 2774 the day of transplantation, p = 0.024 (Figure 1D). The sum of all class I MFI was 8,232 ± 7,903 before desensitization and 6,102 ± 10,570 at 12-month, p = 0.507 (Figure 1E) and all class II MFI was 4195 ± 5058 before desensitization and was 586 ± 681 at 12-month, p = 0.170 (Figure 1F).
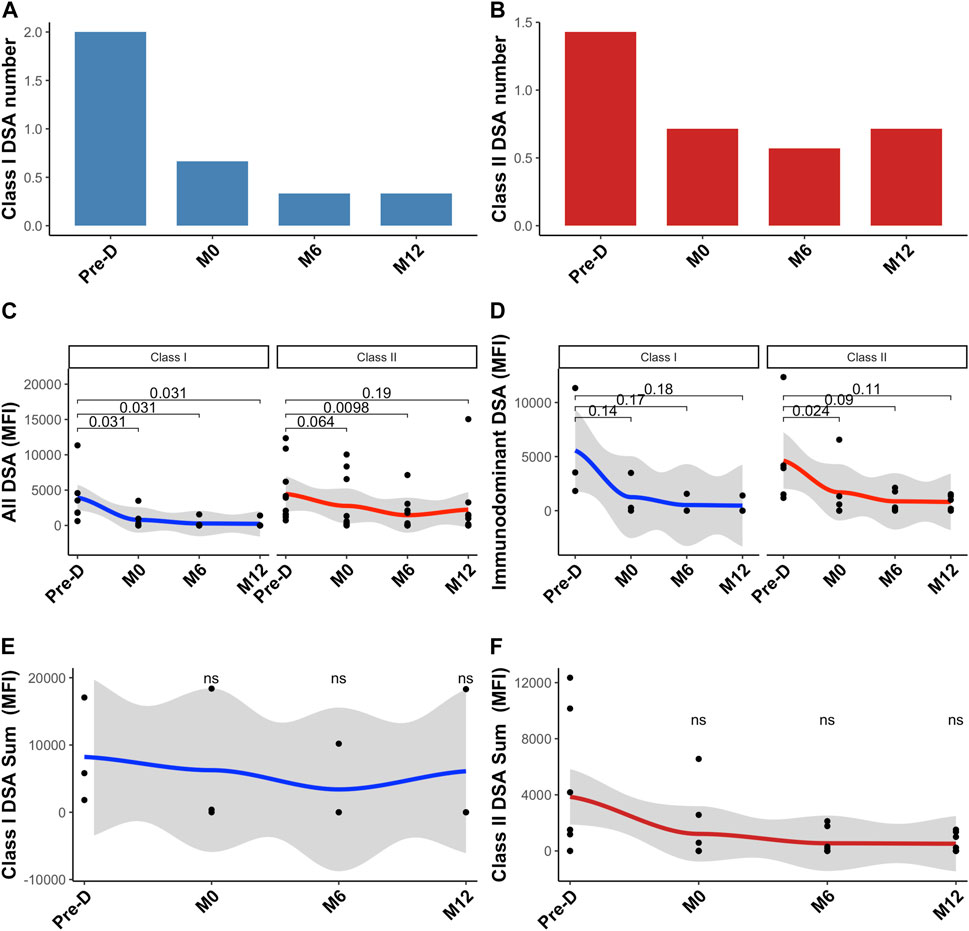
Figure 1. Donor-specific antibodies change post desensitization and transplantation. Trends in the number of class I DSA (A), class II DSA (B), in all class I and II DSA MFI (C), in immunodominant class I and class II DSA (D), in class I sum of MFI (E) and in class II sum of MFI (F). Blue is for class I DSAs and Red is for class II DSAs. Pre-D: pre-desensitization.
At the end of the follow-up period (61.6 months [49–68]), all patients were alive and none of them had lost their graft. Three patients developed acute rejection: two patients developed AMR and one patient had a cellular borderline rejection. All patients were successfully treated with steroids pulse and plasmapheresis. Although non statistically significant, immunodominant DSA mean MFI was higher in patients with rejection as compared with those without rejection (8,503 ± 5,808 versus 2,866 ± 1,413.8, p = 0.180). Similarly, sum of all DSA MFI was higher in patients with rejection: 12,776 ± 11,173 as compared to those without rejection: 3,619 ± 4,116 (p = 0.086).
Changes in B Cells Subsets
Upon rituximab therapy, CD19+ B cells were effectively depleted and fully recovered at 6 months post-transplant (Figure 2A). The percentage of memory B cells (mBC) significantly declined after desensitization and did not fully recover post-transplantation (Figure 2B).
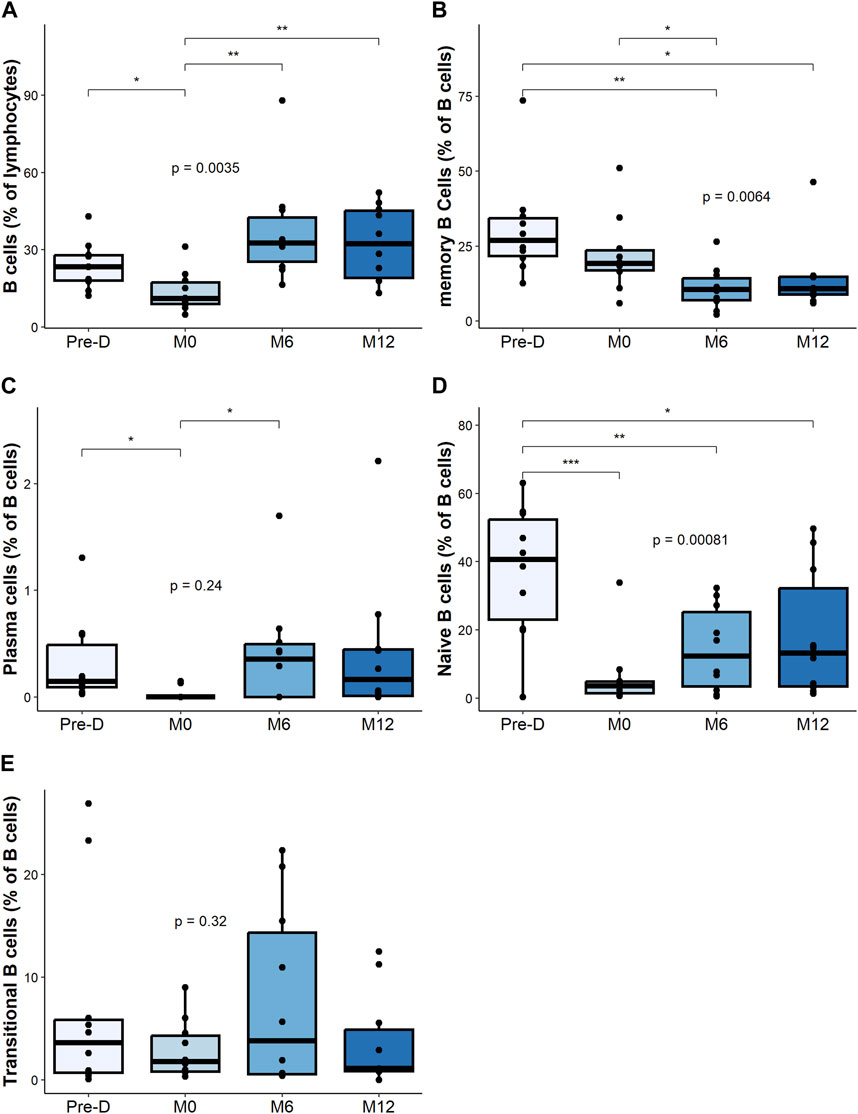
Figure 2. B cell composition and change post desensitization and transplantation. Trends in B cells and plasma cells before and after desensitization and transplantation: total B cells (CD19+CD3−CD14−) (A), memory B cells (CD19+CD38− CD24+ CD27+) (B), plasma cells (CD19+CD27hi CD38hi) (C), naïve B cells (CD19+CD27– IgD+) (D). Transitional B cells (CD19+ CD27– CD24hi) (E). *p < .05 by Anova test. PBMC were also available for all 10 patients at the 4 timepoints.
The frequency of plasma cells decreased, but not significantly with desensitization therapy. We observed a return to baseline level at 6 months and at 12 months after transplantation (Figure 2C).
We observed a marked decrease of the naive B cell (CD27− IgD+) after desensitization that did not fully recover post-transplantation (Figure 2D). The frequency of transitional B cells did not significantly change after desensitization (Figure 2E).
We found no correlation between DSA and anti-HLA specific B cells.
Changes in Proliferative B Cell Subsets
While the relative percentage of total Ki67+ B cells was not impacted by desensitization and transplantation (Figure 3A), desensitization was associated with a decrease of Ki67+ mBC percentage, followed by an increase at M6 and M12 (Figure 3B).
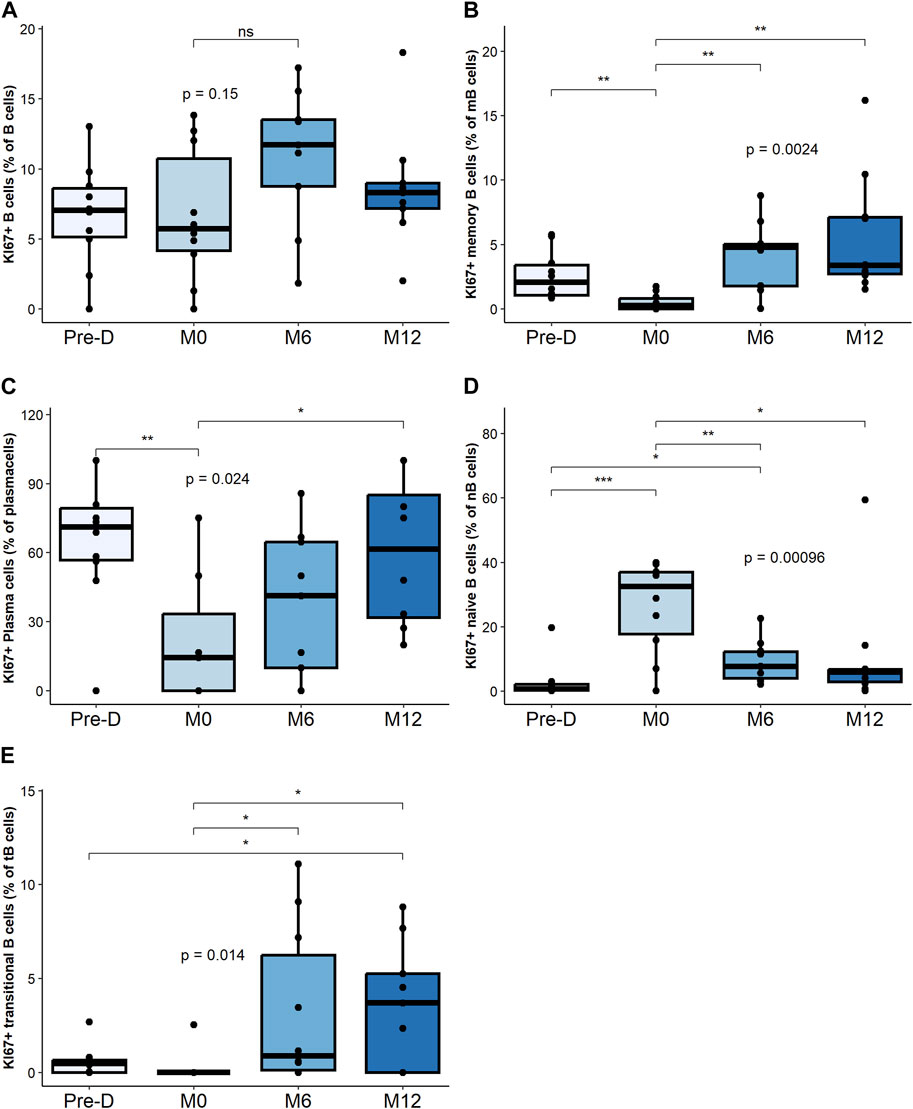
Figure 3. Proliferative B cell composition and change post desensitization and transplantation. Trends in KI67 + B cells and plasma cells before and after desensitization and transplantation: total B cells (CD19+CD3−CD14−) (A), memory B cells (CD19+CD38− CD24+ CD27+) (B), plasma cells (CD19+CD27hi CD38hi) (C), naïve B cells (CD19+CD27– IgD+) (D). Transitional B cells (CD19+ CD27– CD24hi) (E). *p < .05 by Anova test. PBMC were also available for all 10 patients at the 4 timepoints.
The percentage of Ki67+ plasma cells significantly decreased post-desensitization and recovered to pre-desensitization levels at M12 post-transplant (Figure 3C).
The percentage of Ki67+ naïve B cells, significantly increased post-desensitization and decreased post-transplantation (Figure 3D). The percentage of Ki67+ transitional B cells progressively increase after transplant increased up to M12 (Figure 3E).
Proliferative mBC and transitional B cells are the subsets that increased the most after transplant.
Desensitization Does Not Reduce Donor-Specific Anti-HLA B Cells
Next, we focused on the donor-specific anti-HLA B cells by FluoroSpot. The number of total IgG spots secreted by polyclonal antibody secreting cells was positively correlated (p = 0.012) with the percentage of mBC assessed by Flow cytometry (Supplementary Figure S3) but not with the other B cells subtypes (data not shown). Median number of donor specific anti-HLA B cells was 17.6 spots [1.7–28.6] before desensitization and 7.2 spots [1.7–18.2] at pre-transplantation, p = 0.41. This secretion remained stable at 6 months: 7.8 spots [3.8–20] and at 12 months: 4.4 spots [1.6–8.2] post-transplantation. Figure 4 shows the evolution of class I and class II donor-specific anti-HLA B cells. There was no statistical difference between patients with rejection and those without rejection regarding the evolution of donor-specific anti-HLA B cells.
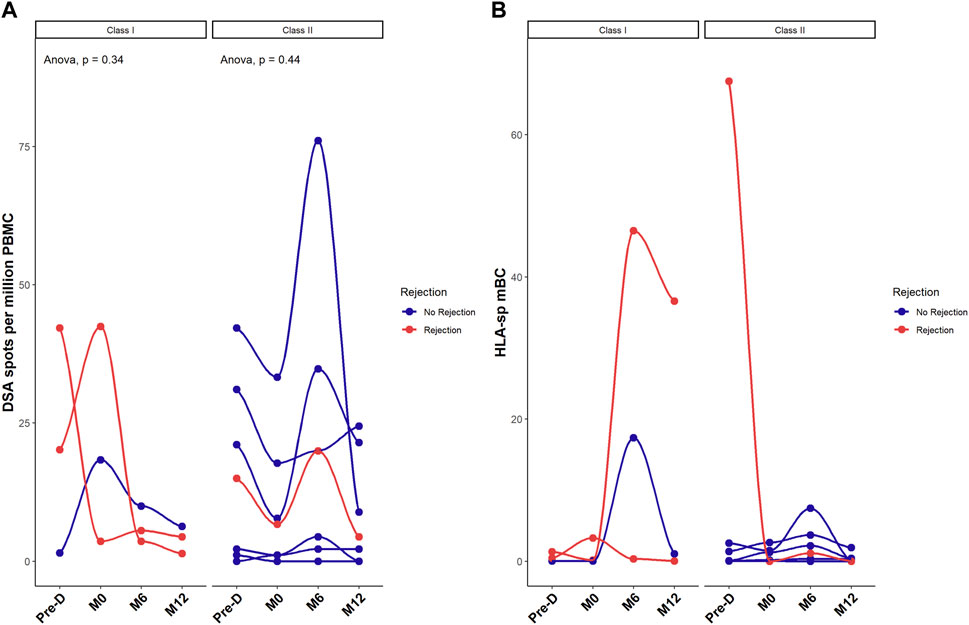
Figure 4. Desensitization does reduce donor-specific HLA memory B cells. Donor-specific memory B cell differentiation into plasma cells assessed by FluoroSpot measuring donor-specific antibodies (spots) and expressed as mean number of spots per million of PBMC (A) and ratio between HLA-specific mBCs over the total polyclonal IgG mBCs in each patient (B). Red dots correspond to patients with rejection. *p < .05 by Anova test. PBMC were also available for all 10 patients at the 4 timepoints.
Three patients developed rejection post transplantation. The number of donor-specific anti-HLA IgG was higher in those three patients at pre-desensitization time as compared to the recipients without humoral rejection although this difference did not reach significance: 26 ± 14 spots in patients with rejection, versus 14 ± 17 spots in recipients without rejection, p = 0.37 (despite a significantly higher total IgG secretion in patients without rejection: 4950 spots per million of PBMC [999–17,238] versus 2475 [876–25,825] in patients with AMR, p < 0.001). Supplementary Figure S4 illustrates the stereotypical evolution profile of DSA in relation to similar HLA-specific mBC as measured by FluoroSpot in 4 patients. This data shows that there is no clear correlation between the levels of DSA and the frequency of donor-specific mBC.
Changes in B Cell Metabolic Profile
Before desensitization, the metabolic profile was similar across all B subpopulations (Supplementary Figure S5A), were also not statistically different at 12 months post-post-transplantation (M12) (Supplementary Figure S5B).
Within the overall B cell population, desensitization and transplantation had no significant impact on cell metabolism (Figure 5A). We next zoomed in on B cell subpopulations metabolism.
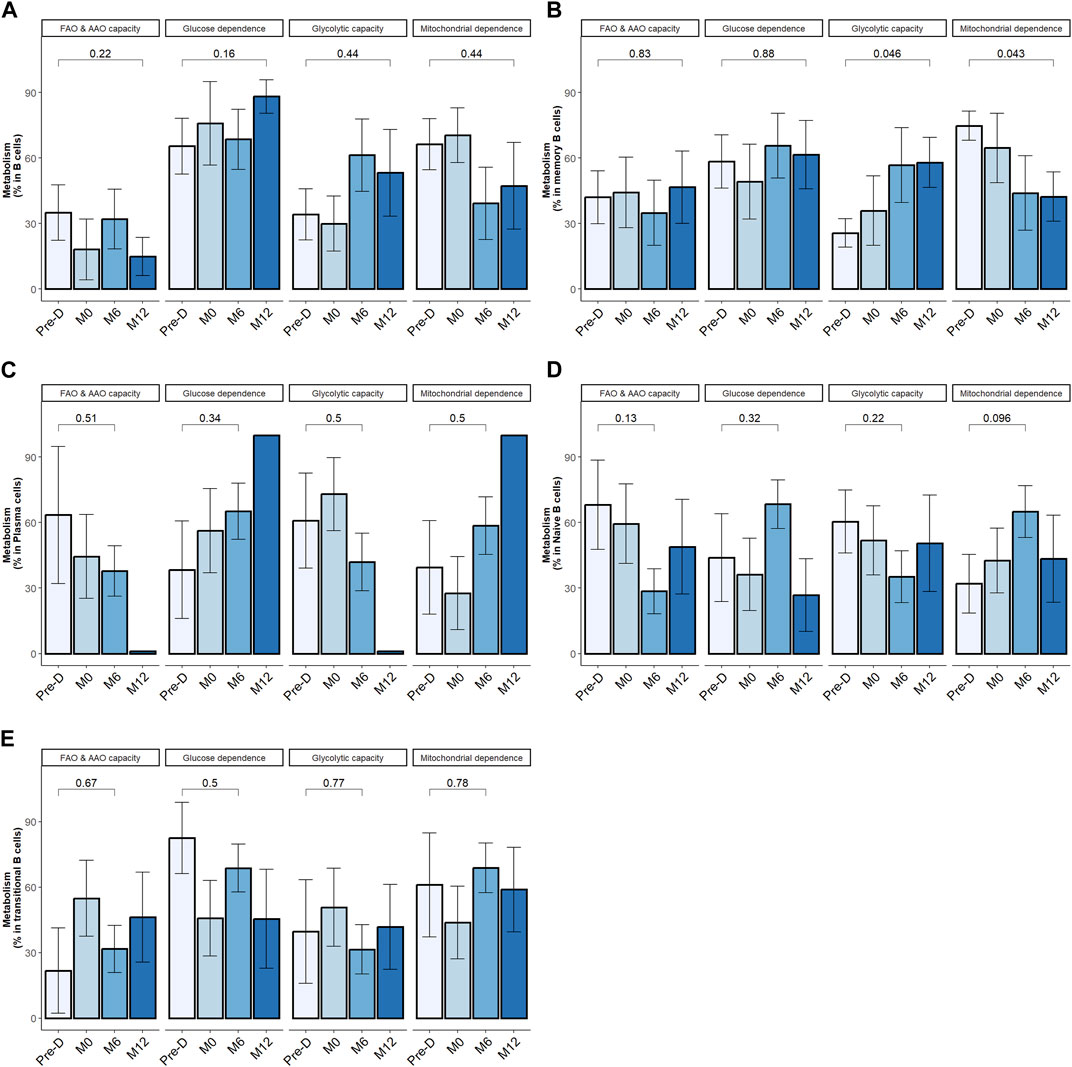
Figure 5. Desensitization and transplantation impact on B cell metabolism. Trends in B cell subsets metabolism profile evolution before desensitization (Pre-D), pre-transplantation (M0), at month-6 (M6) and at month-12 (M12) post-transplantation; total B cells (CD19+CD3−CD14−) (A), memory B cells (CD19+CD38− CD24+ CD27+) (B), plasma cells (CD19+CD27hi CD38hi) (C), naïve B cells (CD19+CD27− IgD+) (D). Transitional B cells (CD19+ CD27− CD24hi) (E). The p-value is indicated the evolution of metabolism percentage between Pre-D and M12. *p < .05 by Wilcoxon test. FAO: fatty acids oxidation; AAO: amino acids oxidation. 4 patients had 1 timepoint missing.
In mBC, desensitization and transplantation were associated with an increase of glycolytic capacity between pre-desensitization and M12 and a decrease of mitochondrial dependency (Figure 5B). FAO/AAO capacity and glucose dependence were not impacted. To further define the dependency of mBC in kidney transplant recipients on glycolysis, we performed ELISpot with different metabolism inhibitors. Selective inhibition of glycolysis resulted in a significant decrease of IgG secretion (spots) by activated memory B cells, while OXPHOS inhibition did not affect it (Figure 6).
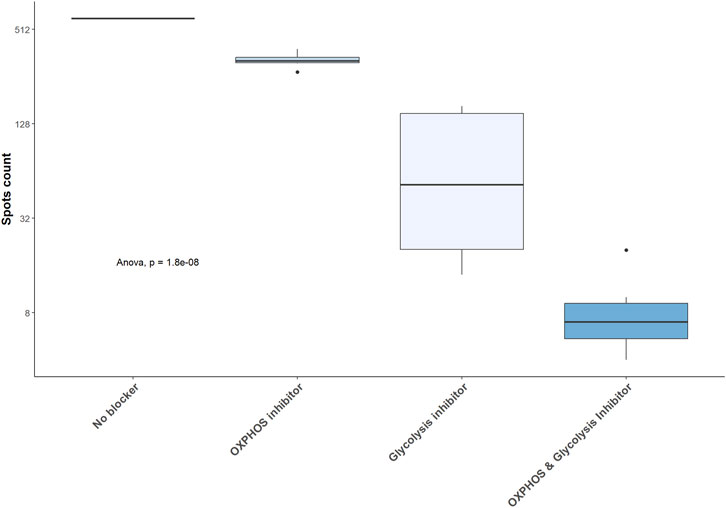
Figure 6. Glycolysis inhibition results in a significant decrease in IgG secretion by activated memory B cell. IgG secretion assessed by ELISpot in 5 kidney transplant recipients and expressed as raw number of spots. OXPHOS: oxidative phosphorylation.
Metabolic requirements did not significantly change over follow-up period in naïve B cells, transitional B cells and plasma cells (Figures 5C–E). In KI67+ plasma cells, percentage of FAO/AAO capacity significantly increased post desensitization and transplantation while glucose dependence percentage significantly decreased (Supplementary Figure S6). The metabolic modifications were not statistically significant in KI67+ mBC. The tendency was similar with a median increase of glycolytic capacity from 26% at baseline to 60% at M12, p = 0.44 and a median decrease of mitochondrial dependence from 73% at baseline to 31% at M12.
Discussion
Previous studies have shown a clear correlation between circulating HLA-specific mBCs and high risk of antibody-mediated acute and chronic rejection in kidney transplantation [14, 15]. However, no study has formally investigated the changes in circulating HLA-specific mBCs after desensitization. Our data indicate that apheresis and B cell depletion, together with chronic immunosuppression are effective in removing DSA allowing for transplantation procedure, but do not clear HLA-specific mBCs. These cells are mainly located in peripheral lymphoid organs and, upon re-encounter with target antigens, can differentiate into antibody-secreting cells [17]. Therefore, they may account for the high risk of ABMR despite effective DSA removal after desensitization [18].
Long-lived plasma cells are also a major source of alloantibodies. These cells reside primarily in the bone marrow where they continuously secrete antibodies [19]. Our data indicate that desensitization and immunosuppression are not able to reduce circulating plasma cells but reduced the proliferative ratio of plasma cells at the initial phase. A limitation of our study lies in the fact that we only analyzed circulating plasma cells and long-lived plasma cells reside in the bone marrow. Some data on long-lived plasma cells suggest that their metabolism requires more glucose and amino acids than short-lived plasma cells (ref lam cell rep). No study has reported on the metabolic changes induced by allostimulation of long-lived plasma cells.
Metabolism has been shown to shape the survival and functionality of innate and adaptive immune cells [20, 21]. However, metabolic profile of B cells has been poorly characterized, especially in the field of solid-organ transplantation. We observed that, in sensitized patients, B cell subsets have a similar baseline metabolism profile characterized by a high glucose and mitochondrial dependency associated with a lower level of FAO, AAO and glycolytic capacities. Interestingly, after desensitization and after transplantation, we observed different metabolic modifications within the B cell subpopulations. After desensitization, total B cells re-emerged to baseline level but with more heterogenicity in their metabolism capacities. mBC percentages did not fully recover after transplant. Of note, those that formed after desensitization had a high glucose dependency, higher glycolytic capacity, and lower OXPHOS metabolism than at baseline. Interestingly, Torigeo et al. showed that glucose uptake and glycolysis are important for mBC differentiation into plasma cells [22]. This may at least in part explain the glycolytic capacity increase in mBC post-KT of sensitized kidney recipients and the major impact of antibody secretion by glycolysis inhibitor in the ELISpot results. After desensitization and transplantation, we also observed a re-emergence of proliferative plasma cells with a different metabolic profile, i.e., with higher FAO/AAO capacity and less glucose dependence. This is consistent with Lam et al. showing an elevated expression of an amino-acid transported in long-lived plasma cells [23].
Improvement in immunosuppressive strategies have contributed to improve long-term patient and graft survival. Yet, long-term immunosuppression is burdened by increased risk of infections, cancer, and metabolic complications [24–26]. Targeting metabolism, especially by blocking specific pathways may effectively control alloimmune response.
We tried to directly modify the metabolism of antibody-secreting cells using glycolysis and OXPHOS inhibitors. To date, direct modulation of immune cell metabolism has only been assessed in innate immune cells and T lymphocytes [27, 28]. The authors showed that, the adjunction of metabolism inhibitors (glycolysis inhibitor and glutamine inhibitor) on top of immunosuppression, increases skin and heart allograft survival in a mice model [29, 30].
Several limitations exist in our study. Firstly, the sample size of included patients is relatively small. This limitation stems from the infrequent occurrence of desensitization procedures within our patient population. From a technical point of view, cryopreservation may impact the results of metabolism assessment. To minimize this potential confounder, we allowed cells to recover in the incubator for a short period before doing the analyses [31, 32]. However, despite this constraint, our cohort exhibits comprehensive phenotypic characterization. Additionally, we were able to analyze serial samples from all participants, allowing for thorough investigation. Our investigation focused on analyzing B cell metabolism, yet numerous other cell subtypes play crucial roles in the cascade of allograft rejection and merit deeper examination. Recent literature highlights the significance of glycolysis in macrophages that infiltrate the graft (REF transplant). Additionally, metabolic pathways like the polyamine pathway have been implicated in modulating Th17 pathogenicity (ref COMP). There remains ample scope for elucidating the immune-metabolism nuances specific to each cell subtype within the realm of solid-organ transplantation and rejection.
Our data in sensitized patients indicate that circulating mBC emerging after desensitization modify their metabolic profile, which is primarily dependent on glycolysis. Therefore, targeting this pathway specifically in mBC may represent a valuable therapeutic option to deplete mBCs, avoid the antibody rebound and maybe reduce the risk of AMBR.
Data Availability Statement
The raw data supporting the conclusions of this article will be made available by the authors, without undue reservation.
Ethics Statement
The studies involving humans were approved by the protocol was approved by investigational review board at Grenoble University Hospital (AC-2019-3627) and by French National committee for data protection (CNIL; approval number 1987785v0). The studies were conducted in accordance with the local legislation and institutional requirements. The participants provided their written informed consent to participate in this study.
Author Contributions
JN, LC, and AT performed the experiments. JN, TJ, and ZM-J participated in the study design. JN, LD, and ZM-J participated in the data analysis. CD provided and analyzed the anti-HLA data. JN and PC wrote the manuscript. PM, LR, and PS reviewed and corrected the manuscript. All authors contributed to the article and approved the submitted version.
Funding
The author(s) declare financial support was received for the research, authorship, and/or publication of this article. This study was funded by ATMIR foundation (Association pour le Traitement des Malades Insuffisants Rénaux), Grant 2022, https://www.atmir.org/.
Conflict of Interest
The authors declare that the research was conducted in the absence of any commercial or financial relationships that could be construed as a potential conflict of interest.
Acknowledgments
We thank the Microcell core facility of the Institute for Advanced Biosciences (UGA—Inserm U1209—CNRS 5309), especially Mylene Pezet for her help with flow cytometry experiments. This facility belongs to the IBISA-ISdV platform, member of the national infrastructure France-BioImaging supported by the French National Research Agency (ANR-10-INBS-04).
Supplementary Material
The Supplementary Material for this article can be found online at: https://www.frontierspartnerships.org/articles/10.3389/ti.2024.13029/full#supplementary-material
Abbreviations
FAO/AAO, fatty acid and amino acid oxidation; HLA, Human Leukocyte Antigen; IL-2, interleukin 2; mBC, memory B cells; Oligo, Oligomycin; OXPHOS, Oxidative phosphorylation; PBMC, Peripheral Blood Mononuclear Cells; SCENITH, Single-Cell ENergetIc metabolism by profiling Translation inhibition; 2-DG, 2-deoxyglucose.
References
1. Jackson, KR, Covarrubias, K, Holscher, CM, Luo, X, Chen, J, Massie, AB, et al. The National Landscape of Deceased Donor Kidney Transplantation for the Highly Sensitized: Transplant Rates, Waitlist Mortality, and Posttransplant Survival Under KAS. Am J Transpl (2019) 19(4):1129–38. doi:10.1111/ajt.15149
2. Jackson, KR, Motter, JD, Kernodle, A, Desai, N, Thomas, AG, Massie, AB, et al. How Do Highly Sensitized Patients Get Kidney Transplants in the United States? Trends Over the Last Decade. Am J Transpl (2020) 20(8):2101–12. doi:10.1111/ajt.15825
3. Pruthi, R, Hilton, R, Pankhurst, L, Mamode, N, Hudson, A, Roderick, P, et al. UK Renal Registry 16th Annual Report: Chapter 4 Demography of Patients Waitlisted for Renal Transplantation in the UK: National and Centre-Specific Analyses. Nephron Clin Pract (2013) 125(1-4):81–98. doi:10.1159/000360023
4. Montgomery, RA, Lonze, BE, King, KE, Kraus, ES, Kucirka, LM, Locke, JE, et al. Desensitization in HLA-Incompatible Kidney Recipients and Survival. N Engl J Med (2011) 365(4):318–26. doi:10.1056/NEJMoa1012376
5. Vo, AA, Petrozzino, J, Yeung, K, Sinha, A, Kahwaji, J, Peng, A, et al. Efficacy, Outcomes, and Cost-Effectiveness of Desensitization Using IVIG and Rituximab. Transplantation (2013) 95(6):852–8. doi:10.1097/TP.0b013e3182802f88
6. Jordan, SC, Legendre, C, Desai, NM, Lorant, T, Bengtsson, M, Lonze, BE, et al. Imlifidase Desensitization in Crossmatch-Positive, Highly Sensitized Kidney Transplant Recipients: Results of an International Phase 2 Trial (Highdes). Transplantation (2021) 105(8):1808–17. doi:10.1097/TP.0000000000003496
7. Jouve, T, Laheurte, C, Noble, J, Weinhard, J, Daligault, M, Renaudin, A, et al. Immune Responses Following Tocilizumab Therapy to Desensitize HLA-Sensitized Kidney Transplant Candidates. Am J Transpl (2021) 3. doi:10.1111/ajt.16709
8. Jin, MK, Cho, JH, Kwon, O, Hong, KD, Choi, JY, Yoon, SH, et al. Successful Kidney Transplantation After Desensitization Using Plasmapheresis, Low-Dose Intravenous Immunoglobulin, and Rituximab in Highly Sensitized Patients: A Single-Center Experience. Transpl Proc. (2012) 44(1):200–3. doi:10.1016/j.transproceed.2011.11.040
9. Agarwal, D, Luning Prak, ET, Bharani, T, Everly, M, Migone, TS, Cancro, M, et al. BLyS Neutralization Results in Selective Anti-HLA Alloantibody Depletion Without Successful Desensitization. Transpl Immunol (2021) 69:101465. doi:10.1016/j.trim.2021.101465
10. Shapouri-Moghaddam, A, Mohammadian, S, Vazini, H, Taghadosi, M, Esmaeili, SA, Mardani, F, et al. Macrophage Plasticity, Polarization, and Function in Health and Disease. J Cel Physiol. (2018) 233(9):6425–40. doi:10.1002/jcp.26429
11. Priyadharshini, B, and Turka, LA. T-Cell Energy Metabolism as a Controller of Cell Fate in Transplantation. Curr Opin Organ Transpl (2015) 20(1):21–8. doi:10.1097/MOT.0000000000000149
12. Argüello, RJ, Combes, AJ, Char, R, Gigan, JP, Baaziz, AI, Bousiquot, E, et al. SCENITH: A Flow Cytometry-Based Method to Functionally Profile Energy Metabolism With Single-Cell Resolution. Cell Metab. (2020) 32(6):1063–75. doi:10.1016/j.cmet.2020.11.007
13. Luque, S, Lúcia, M, Crespo, E, Jarque, M, Grinyó, JM, and Bestard, O. A Multicolour HLA-Specific B-Cell FluoroSpot Assay to Functionally Track Circulating HLA-Specific Memory B Cells. J Immunol Methods (2018) 462:23–33. doi:10.1016/j.jim.2018.07.011
14. Luque, S, Lúcia, M, Melilli, E, Lefaucheur, C, Crespo, M, Loupy, A, et al. Value of Monitoring Circulating Donor-Reactive Memory B Cells to Characterize Antibody-Mediated Rejection After Kidney Transplantation. Am J Transpl (2019) 19(2):368–80. doi:10.1111/ajt.15055
15. Lúcia, M, Luque, S, Crespo, E, Melilli, E, Cruzado, JM, Martorell, J, et al. Preformed Circulating HLA-Specific Memory B Cells Predict High Risk of Humoral Rejection in Kidney Transplantation. Kidney Int (2015) 88(4):874–87. doi:10.1038/ki.2015.205
16. Kotecha, N, Krutzik, PO, and Irish, JM. Web-Based Analysis and Publication of Flow Cytometry Experiments. Curr Protoc Cytom (2010) Chapter 10:Unit10.17. Chapter 10:Unit10.17. doi:10.1002/0471142956.cy1017s53
17. Cancro, MP, and Tomayko, MM. Memory B Cells and Plasma Cells: The Differentiative Continuum of Humoral Immunity. Immunol Rev (2021) 303(1):72–82. doi:10.1111/imr.13016
18. Okada, D, Okumi, M, Kakuta, Y, Unagami, K, Iizuka, J, Takagi, T, et al. Outcome of the Risk-Stratified Desensitization Protocol in Donor-Specific Antibody-Positive Living Kidney Transplant Recipients: A Retrospective Study. Transpl Int (2018) 20:1008–17. doi:10.1111/tri.13269
19. Nutt, SL, Hodgkin, PD, Tarlinton, DM, and Corcoran, LM. The Generation of Antibody-Secreting Plasma Cells. Nat Rev Immunol (2015) 15(3):160–71. doi:10.1038/nri3795
20. Baker, SA, and Rutter, J. Metabolites as Signalling Molecules. Nat Rev Mol Cel Biol (2023) 24:355–374. doi:10.1038/s41580-022-00572-w
21. Hu, C, Xuan, Y, Zhang, X, Liu, Y, Yang, S, and Yang, K. Immune Cell Metabolism and Metabolic Reprogramming. Mol Biol Rep (2022) 49(10):9783–95. doi:10.1007/s11033-022-07474-2
22. Torigoe, M, Iwata, S, Nakayamada, S, Sakata, K, Zhang, M, Hajime, M, et al. Metabolic Reprogramming Commits Differentiation of Human CD27+IgD+ B Cells to Plasmablasts or CD27-IgD- Cells. J Immunol (2017) 199(2):425–34. doi:10.4049/jimmunol.1601908
23. Lam, WY, Jash, A, Yao, CH, D’Souza, L, Wong, R, Nunley, RM, et al. Metabolic and Transcriptional Modules Independently Diversify Plasma Cell Lifespan and Function. Cell Rep. (2018) 24(9):2479–92. doi:10.1016/j.celrep.2018.07.084
24. Sprangers, B, Nair, V, Launay-Vacher, V, Riella, LV, and Jhaveri, KD. Risk Factors Associated With Post-Kidney Transplant Malignancies: An Article From the Cancer-Kidney International Network. Clin Kidney J (2018) 11(3):315–29. doi:10.1093/ckj/sfx122
25. Attias, P, Melica, G, Boutboul, D, De Castro, N, Audard, V, Stehlé, T, et al. Epidemiology, Risk Factors, and Outcomes of Opportunistic Infections After Kidney Allograft Transplantation in the Era of Modern Immunosuppression: A Monocentric Cohort Study. J Clin Med (2019) 8(5):594. doi:10.3390/jcm8050594
26. Bamgbola, O. Metabolic Consequences of Modern Immunosuppressive Agents in Solid Organ Transplantation. Ther Adv Endocrinol Metab (2016) 7(3):110–27. doi:10.1177/2042018816641580
27. Everts, B, and Pearce, EJ. Metabolic Control of Dendritic Cell Activation and Function: Recent Advances and Clinical Implications. Front Immunol (2014) 5:203. doi:10.3389/fimmu.2014.00203
28. Svajger, U, Obermajer, N, and Jeras, M. Dendritic Cells Treated With Resveratrol During Differentiation From Monocytes Gain Substantial Tolerogenic Properties Upon Activation. Immunology (2010) 129(4):525–35. doi:10.1111/j.1365-2567.2009.03205.x
29. Cheng, CH, Lee, CF, Oh, BC, Furtmüller, GJ, Patel, CH, Brandacher, G, et al. Targeting Metabolism as a Platform for Inducing Allograft Tolerance in the Absence of Long-Term Immunosuppression. Front Immunol (2020) 11:572. doi:10.3389/fimmu.2020.00572
30. Lee, CF, Lo, YC, Cheng, CH, Furtmüller, GJ, Oh, B, Andrade-Oliveira, V, et al. Preventing Allograft Rejection by Targeting Immune Metabolism. Cell Rep (2015) 13(4):760–70. doi:10.1016/j.celrep.2015.09.036
31. Vogel, A, García González, P, and Argüello, RJ. Measuring the Metabolic State of Tissue-Resident Macrophages via SCENITH. Methods Mol Biol (2024) 2713:363–76. doi:10.1007/978-1-0716-3437-0_25
Keywords: donor-specific antibody, desensitization, kidney transplantation, metabolism, memory B cells, glycolysis
Citation: Noble J, Cabezas L, Truffot A, Dumolard L, Jouve T, Malvezzi P, Rostaing L, Dard C, Saas P, Cravedi P and Macek-Jilkova Z (2024) Glycolysis Changes in Alloreactive Memory B Cells in Highly Sensitized Kidney Transplant Recipients Undergoing Desensitization Therapy. Transpl Int 37:13029. doi: 10.3389/ti.2024.13029
Received: 23 March 2024; Accepted: 25 June 2024;
Published: 08 July 2024.
Copyright © 2024 Noble, Cabezas, Truffot, Dumolard, Jouve, Malvezzi, Rostaing, Dard, Saas, Cravedi and Macek-Jilkova. This is an open-access article distributed under the terms of the Creative Commons Attribution License (CC BY). The use, distribution or reproduction in other forums is permitted, provided the original author(s) and the copyright owner(s) are credited and that the original publication in this journal is cited, in accordance with accepted academic practice. No use, distribution or reproduction is permitted which does not comply with these terms.
*Correspondence: Johan Noble, am5vYmxlQGNodS1ncmVub2JsZS5mcg==
†ORCID: Johan Noble, orcid.org/0000-0002-2329-0392; Thomas Jouve, orcid.org/0000-0001-9016-7506; Paolo Malvezzi, orcid.org/0000-0002-8549-5561; Lionel Rostaing, orcid.org/0000-0002-5130-7286; Philippe Saas, orcid.org/0000-0002-8857-9939; Paolo Cravedi, orcid.org/0000-0001-7837-0923; Zuzana Macek-Jilkova, orcid.org/0000-0002-2553-5971