 Haris Omić1
 Farsad Eskandary1
 Dietrich Beitzke2Marcos Wolf3
 Nicolas Kozakowski4
 Georg Böhmig1Andrea Beck-Tölly5
 Michael Eder1*
- 1Division of Nephrology and Dialysis, Department of Medicine III, Medical University of Vienna, Vienna, Austria
- 2Division of Cardiovascular and Interventional Radiology, Department of Biomedical Imaging and Image-Guided Therapy, Medical University of Vienna, Vienna, Austria
- 3Center for Medical Physics and Biomedical Engineering, Medical University of Vienna, Vienna, Austria
- 4Department of Pathology, Medical University of Vienna, Vienna, Austria
- 5Division of General and Paediatric Radiology, Department of Biomedical Imaging and Image-Guided Therapy, Medical University of Vienna, Vienna, Austria
Quantitative magnetic resonance imaging (MRI) is emerging as a non-invasive tool to measure tissue scarring in renal allografts. However, whether prolonged T1 relaxation time results in lower transplant survival rates is unknown. This retrospective cohort study analyzed the capability to predict renal allograft dysfunction based on median T1 time. Forty-six transplant recipients with non-contrast 1.5T MRI and allograft biopsy were included. The primary endpoint was the eGFR slope over 24 months. T1 relaxation time correlated significantly with eGFR levels at all follow-up stages. Patients with T1 relaxation time above the median (T1high) had a consistent decline in kidney function as compared to the patient group below the median (T1low): overall eGFR slope: 11.3 vs. 1.4 mL/min/1.73 m2 over 24 months, p = 0.016. Graft survival rates at 24 months were 52% in the T1high vs. 87% in the T1low group, p = 0.0015. ROC analysis discovered a positive predictive value of 52% and a negative predictive value of 91% for graft loss. T1 mapping identified patients with a persistent decline of allograft function and an increased risk of allograft loss. MRI could significantly influence monitoring strategies in transplant surveillance, offering a safe, non-invasive alternative to traditional diagnostic methods.
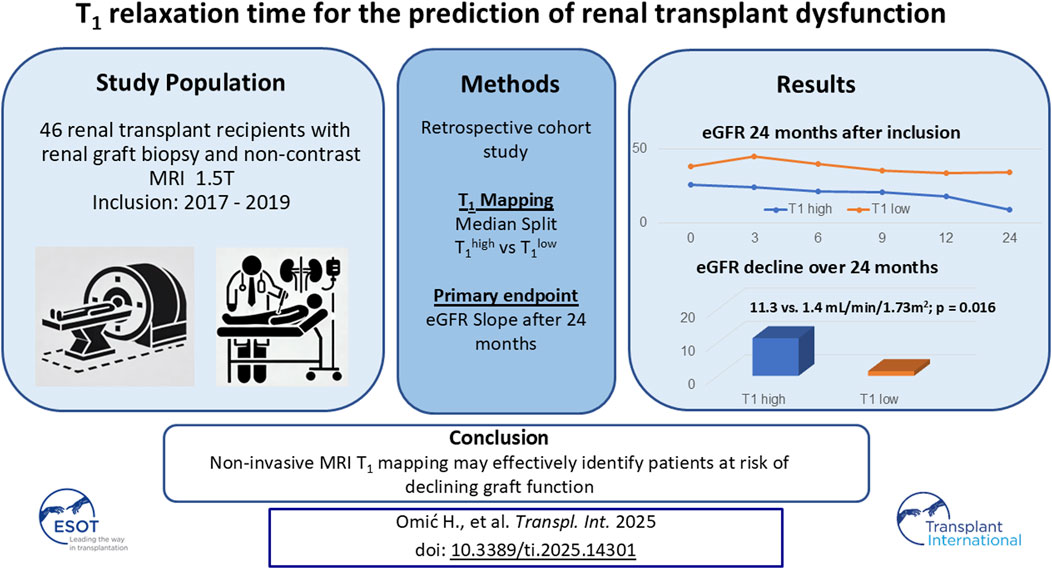
GRAPHICAL ABSTRACT |
Introduction
Kidney transplantation is the preferred treatment for end-stage renal disease [1]. One cornerstone of mitigating renal allograft dysfunction lies in the early, accurate diagnosis of graft pathologies and prompt initiation of treatment. Ideally, a diagnostic tool should detect allograft dysfunction, differentiate between its etiologies, and monitor graft function throughout therapeutic interventions, all while minimizing patient risk.
Currently, percutaneous biopsies are the gold standard for diagnosing kidney allograft pathologies. However, the procedure is not without risks, including a significant complication rate of up to 2% in transplanted kidneys [2, 3]. Biopsies are also susceptible to interobserver variability and sampling errors, which can compromise diagnostic accuracy [4, 5]. Furthermore, practical limitations such as anticoagulation therapy, hypertension, urinary infections, or simply the patient’s subjective refusal may delay a biopsy and, consequently treatment initiation. Especially in the field of renal transplantation, where sequential biopsies are common, there is an emerging interest in exploring the potential of magnetic resonance imaging (MRI) as a complementary non-invasive diagnostic tool [6–11]. MRI is distinguished by its exceptional soft tissue contrast. Its evolution, particularly in enhancing temporal and spatial resolution, has broadened its application and allows assessing functional aspects of the kidney, including renal perfusion and tissue oxygenation [12–15].
In a recent study from our center, we demonstrated a significant correlation between advanced interstitial fibrosis (Banff ci) and high cortical T1 [8]. T1 was also significantly associated with other chronic lesion markers such as tubular atrophy (Banff ct), glomerular basement membrane double contours (Banff cg), and vascular intimal thickening (Banff cv). This implies that histological scarring leads to local microstructural magneto-chemical alterations, quantifiable by MRI [15, 16]. Similar findings were also reported by other studies exploring the relationship between apparent diffusion coefficient (ADC), T1 and T2 in various kidney allograft pathologies [17–19].
However, previous publications mostly focused on correlations between MRI and biopsy findings measured at one-time point cross-sectionally. The longitudinal assessment of allograft function in relation to T1 values was studied to a much smaller extent. Due to less risk of sampling error in MRI assessments, it may be hypothesized that T1 mapping could even exceed the prognostic value of histologically-quantified lesion markers.
A study from Berchtold et al. showed that ADC was able to predict the progression of interstitial fibrosis more reliably than serum creatinine alone [20]. Yet, to our knowledge, it is unexplored whether high T1 subsequently precedes reduced allograft survival. To test this hypothesis, we analyzed the course of graft function in a group of 46 patients who underwent transplant biopsies and cortical T1 mapping.
Materials and Methods
Study Design and Patient Cohort
The aim of this retrospective cohort study was to analyze the course of renal allograft function in a group of 46 transplant recipients who underwent both MRI and transplant biopsy simultaneously. Thirty-two of those patients were included in our previous prospective study, which focused on assessing correlations between T1 mapping, Banff lesion scores, and conventional graft function parameters [8]. The other fourteen patients underwent MRI before the initial study due to clinical indications and as part of a quality assurance protocol to test its basic feasibility.
Patients were screened for study inclusion at our outpatient clinic. Detailed inclusion criteria are provided in the study from Beck-Tölly et al. [8]. All suitable renal transplant patients scheduled for protocol or indication biopsies were actively asked for study participation. The main inclusion criteria were: age over 18 years and an estimated glomerular filtration rate (eGFR) of more than 10 mL/min/1.73 m2 (calculated using the Modification of Diet in Renal Disease formula). Exclusion criteria included MRI-incompatible metallic implants or pacemakers, claustrophobia, and pregnancy. Recruitment took place from December 2017 to January 2019. Non-contrast MRI scans were performed shortly before or after the biopsy, using a whole-body 1.5 T MR system (MAGNETOM Avanto Fit; Siemens Healthineers; Erlangen, Germany).
The primary endpoint was the course of graft function after assessment of baseline MRI T1. Longitudinal graft function was calculated based on serum creatinine levels measured in a three-month interval over the period of 24 months after the MRI. To further quantify changes in kidney function, the eGFR delta (ΔeGFR) and eGFR slopes were calculated for each observation period.
The secondary endpoint was the frequency of death-censored graft loss in relation to baseline T1. Graft loss was defined as the resumption of dialysis. All participants provided informed consent. Ethical approval for the study was granted by the institutional ethics committee (Approval No. 1893/2017). The study adhered to Good Clinical Practice guidelines, the principles of the Declaration of Helsinki, and the Declaration of Istanbul.
MRI
MRI protocols and methods used in this study have been described in detail elsewhere [8]. In short, we extracted T1 measurements from our multiparametric MRI images, measured across three paraxial (cranial, middle, caudal) and three paracoronal (anterior, middle, posterior) planes, involving six independent regions of interest per plane. The median of those 36 measurements was defined as the overall median T1 cortical relaxation time. The choice to focus this current analysis on T1 was based on results from preceding research, which estimated kidney function based on T1 in patients with glomerulonephritis [21], as well as one study quantitatively evaluating renal function and renal fibrosis in patients with chronic kidney disease [22].
Biopsy
Morphologic lesions were assessed on formalin-fixed paraffin-embedded sections using standard methodology [8]. Banff single lesions and rejection phenotypes were scored based on the Banff 2017 scheme [23]. In addition to Banff criteria, chronic structural damage in kidney grafts was assessed using the chronicity index as described by Haas et al. [24]. This index combines four key histological features: interstitial fibrosis (ci), tubular atrophy (ct), vascular fibrous intimal thickening (cv), and chronic glomerulopathy (cg). Each feature was scored on a scale from 0 (no changes) to 3 (severe changes), with the chronic glomerulopathy score being doubled. The total chronicity index ranged from 0 to 15, with higher scores indicating more significant chronic injury.
Statistical Analysis
Continuous variables were reported as means with standard deviations (SD) or medians with interquartile ranges (IQR). Categorical variables were summarized as counts and percentages. The median split method was employed to divide patients into two groups of equal size based on the overall T1. Hence, the “T1high” group referred to patients with T1 values above and the “T1low” group for patients with T1 values below the median. Spearman´s correlation coefficients were used to analyze the associations between T1 and baseline variables, including transplant age, baseline eGFR, and the histological parameters ci, ct—as well as the chronicity index. To compare the predictive validity of Banff ci scores with T1, Fisher’s Z transformation was performed.
The linear mixed-effects model was performed to analyze the changes in the estimated glomerular filtration rate (eGFR slope) over time between the groups.
To compare graft survival, the Kaplan-Meier survival curve and log-rank test were calculated. To address the loss of graft function and the subsequent missing data points in our longitudinal follow-up, we implemented the “last observation carried forward” (LOCF) imputation method. Additionally, the Receiver Operating Characteristic (ROC) analysis was performed to evaluate the ability of T1 to predict the occurrence of allograft loss. The p-value of <0.05 was considered statistically significant.
Statistical computations and analyses were conducted using SPSS for Mac Version 20 (SPSS Inc., Chicago, IL), GraphPad Prism (GraphPad Prism 10.0.3 (217) Macintosh Version by Software MacKiev © 1994–2023 GraphPad Software, LLC), R (R Core Team, 2023) and RStudio (2022 by Posit Software, PBC).
Results
Study Population
Forty-six patients were included, 30 (65%) were male; the mean age at transplantation was 54.3 ± 14.8 years (mean ± SD). Baseline parameters of the total group and the subgroups (T1high and T1low) are displayed in Table 1. The majority of patients (80.4%) received deceased donor kidneys. The median time from transplantation to study inclusion was 3 years (IQR 0.7–11.2). Six (13%) participants underwent magnetic resonance imaging before [4 ± 2.5 days, (mean ± SD)] and 38 (82.6%) after (7.9 ± 9 days) the biopsy. Two (4.4%) patients had the MRI on the day of the biopsy. The median cortical T1 was 1,369 ms (IQR 1,279–1,511). The median eGFR at the time of biopsy was 30.8 mL/min/1.73 m2 (IQR 20.1–49.6). Fourteen (30.4%) patients reached the endpoint graft loss. Four patients (8.6%) were lost to follow-up before the end of our observation period of 24 months.
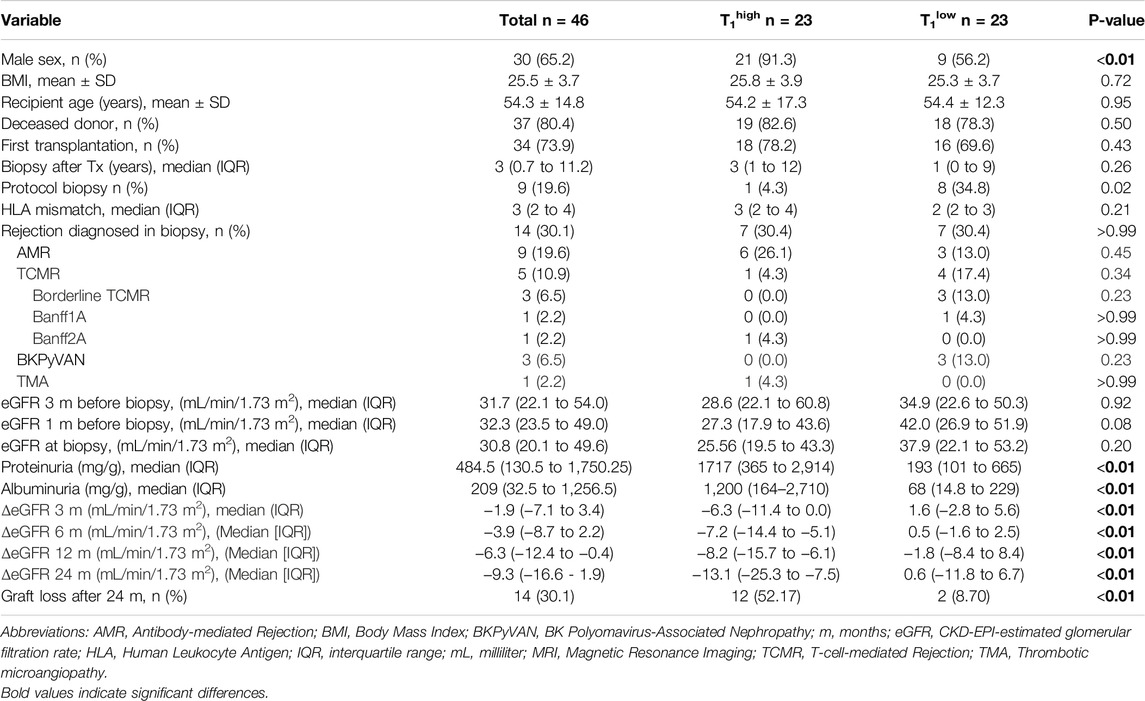
Table 1. Baseline parameters of the study population.
Biopsy Findings
Thirty-seven biopsies (80.4%) were performed based on clinical indications, primarily due to the deterioration of graft function, while the other nine biopsies (19.6%) were protocol biopsies. In 14 (30.4%) biopsies, graft rejection was diagnosed (see Table 1). The overall rate of rejections was equally distributed between the T1high and T1low groups (30.4% each, p > 0.99). Antibody-mediated rejection (AMR) was numerically but not significantly higher in the T1high group (26.1% vs. 13%, p = 0.45). The T cell-mediated rejection (TCMR) frequency also did not differ significantly between both groups (4.3% vs. 17.4%, p = 0.34). Twenty-six allografts (56.6%) exhibited high-grade interstitial fibrosis (ci 2 or 3), and in 18 kidneys (39.1%), high-grade tubular atrophy (ct 2 or 3) was found (Supplementary Table S1). Allografts in the T1high group had more severe interstitial fibrosis: 47.8% with ci 3 compared to 21.7% in the T1low group (p = 0.044). Tubular atrophy was also more advanced in the T1high group (ct 3: 30.4% versus 8.7% in the T1low group, p = 0.031). Although not statistically significant, arterial intimal thickening showed higher severity in the T1high group (52.2% at cv 2 compared to 34.8% in the T1low group, p = 0.059). The severity of glomerular basement membrane double contours (cg), did not differ between the groups; cg grades 2 or 3: 22.7% in the T1high group vs. 14.2% in the T1low group (p = 0.14). Chronicity index differed significantly between the groups: T1high 8.5 (5–11) vs. 3 (IQR 2.5–6.5) in the T1low group, p < 0.01.
Correlation of T1 With Histology and Baseline Variables
There was a significant positive correlation between median T1 and interstitial fibrosis (ρ = 0.36, p = 0.01) as well as tubular atrophy (ρ = 0.45, p < 0.01). Further on, the chronicity index correlated positively with T1 (ρ = 0.46, p < 0.01). No significant correlation was found between median T1 and the time since transplantation (ρ = 0.20, p = 0.16). T1 did not correlate with median eGFR at baseline (ρ = −0.25, p = 0.09, see Figure 1).
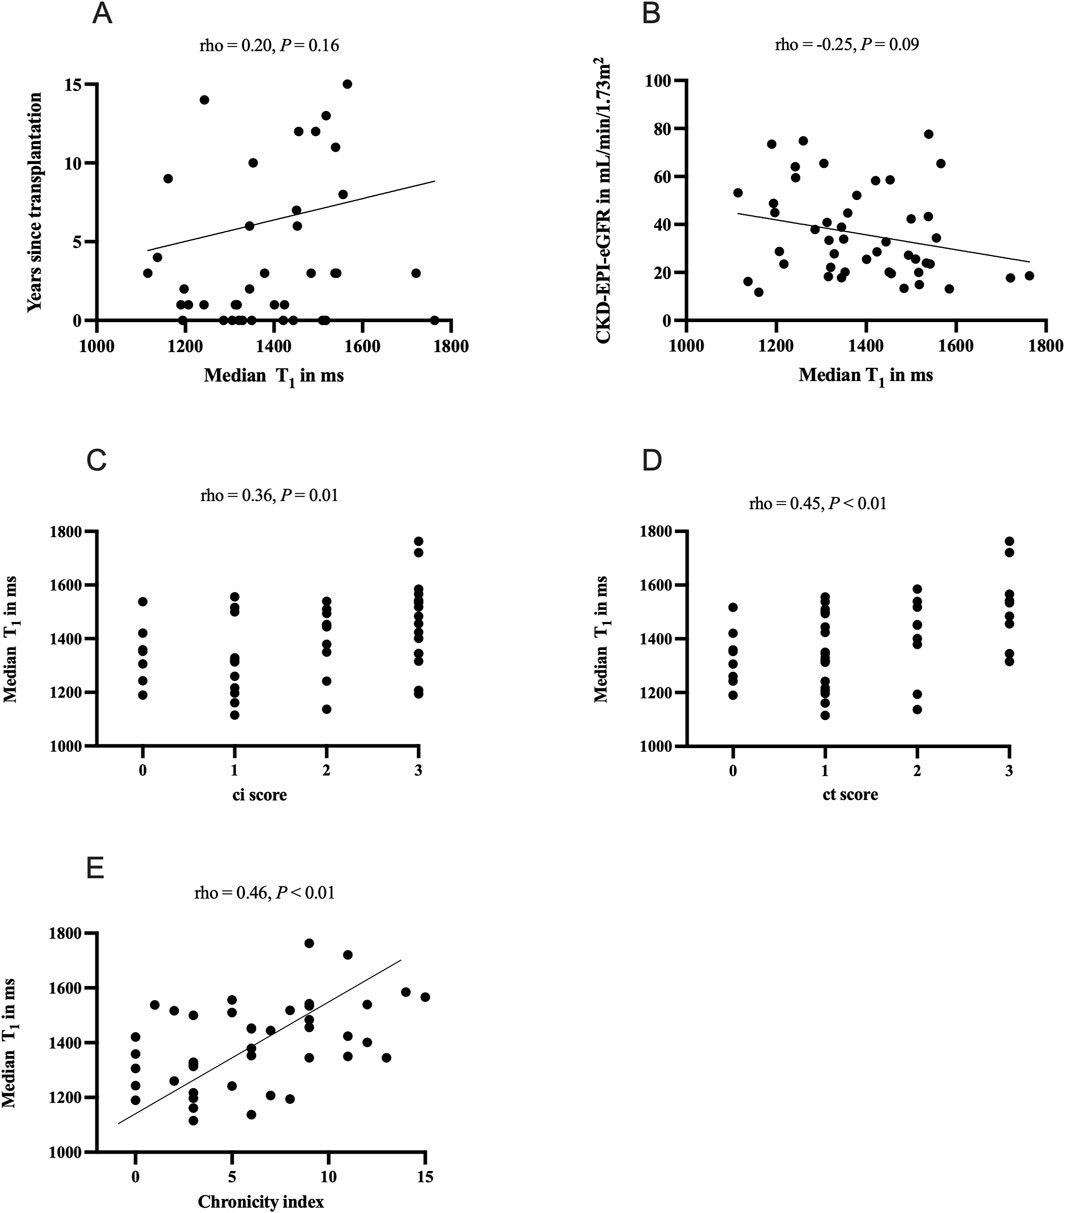
Figure 1. Correlations of clinical and histological parameters and T1 relaxation times: panel (A) correlation of time since transplantation and median T1 in ms; panel (B) correlation of baseline estimated glomerular filtration rate (CKD-EPI-eGFR) and median T1 in ms; panel (C) correlation of interstitial fibrosis (Banff ci score) and median T1 in ms; panel (D) correlation of tubular atrophy (Banff ct score) and median T1 in ms, panel (E) correlation of chronicity index and T1 median in ms. The chronicity index described by Haas et al. [24] combines interstitial fibrosis (ci), tubular atrophy (ct), vascular fibrous intimal thickening (cv), and chronic glomerulopathy (cg).
Analysis of Graft Function in Relation to T1
In the T1high group, eGFR levels consistently declined over time. At baseline, the T1high group had a median eGFR of 25.6 [19.6–43.3 (median, IQR)], compared to 37.9 (22.1–53.2) mL/min/1.73 m2 in the T1low group (p = 0.21) in the T1low group (p = 0.20). Across all other time points, the T1high group experienced a significant and steady decrease in eGFR (Figure 2). The ΔeGFR between various time points (0–3, 0–6, 0–12, and 0–24 months) indicated a significant decline in graft function in the T1high group over all time points. At 3 months, the ΔeGFR was −6.3 (−11.4 to 0.0) mL/min/1.73 m2 in the T1high group and 1.6 (−2.84 to 5.62) mL/min/1.73 m2 in the T1low group (p < 0.01). At 24 months, the T1high group had a ΔeGFR of −13.0 (−25.3 to −7.48) mL/min/1.73 m2 compared to the T1low group with 0.6 (−11.80 to 6.68) mL/min/1.73 m2 (p < 0.01, see Table 1).
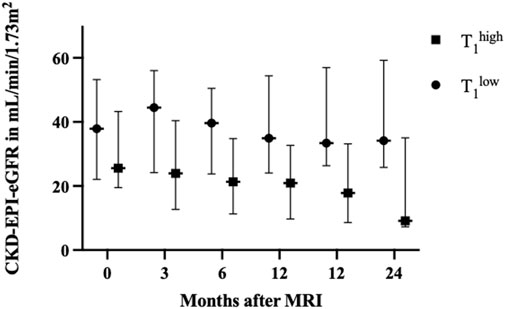
Figure 2. Renal graft function during the follow-up period, compared between the T1high and T1low groups. No differences were observed at baseline. By 3 months, the T1high group’s median estimated glomerular filtration rate (eGFR) was 23.9 (12.7–40.4) mL/min/1.73 m2, compared to 44.5 (24.2–56.01) mL/min/1.73 m2 in the T1low group (p = 0.011). At 6 months, the T1high group’s median eGFR was 21.34 (11.3–34.8) mL/min/1.73 m2 compared to 39.6 (23.8–50.5) mL/min/1.73 m2 in the T1low group (p = 0.007). This trend continued, with the T1high group having a significantly lower median eGFR at 9 months (20.9 [9.7–32.7] mL/min/1.73 m2) than the T1low group (34.9 [24.1–54.4] mL/min/1.73 m2, p = 0.007). By 12 months, the T1high group’s median eGFR had decreased to 17.8 [8.6–33.1] mL/min/1.73 m2, compared to 33.4 [26.3–56.9] mL/min/1.73 m2 in the T1low group (p = 0.006). This significant decline persisted at 24 months, where the T1high group had a median eGFR of 9.1 (7.3–35.0) mL/min/1.73 m2, whereas the T1low group maintained a median of 34.1 (25.8–59.2) mL/min/1.73 m2 (p = 0.005). Values of eGFR are shown as median with whiskers indicating the interquartile range. Abbreviations: MRI: magnetic resonance imaging, CKD-EPI-eGFR: estimated glomerular filtration rate calculated with CKD-EPI equation, in mL/min/1.73 m2.
Correlation of Graft Function and T1
We analyzed the correlation between median T1 and eGFR values over time. A significant inverse relationship was found between T1 and eGFR at different time points. At 3 months, the correlation between T1 and eGFR was moderate (ρ = −0.42, p < 0.01). This negative correlation continued at 6 months (ρ = −0.38, p < 0.01), 12 months (ρ = −0.43, p < 0.01), and remained stable at 24 months (ρ = −0.41, p < 0.01). Fisher’s Z transformation analysis between T1 and ci association with graft function revealed no significant differences, showing that T1 is similarly correlated with kidney function as the established ci score (details see Supplementary Table S2). In the subgroup, including only patients who underwent protocol biopsies, we also found significant correlations between T1 and eGFR at months 3 (ρ = −0.71, p = 0.047), 9 (ρ = −0.81, p = 0.015), 15 (ρ = −0.81, p = 0.015), 18 (ρ = −0.74, p = 0.037), 21 (ρ = −0.81, p = 0.015), and 24 (ρ = −0.83, p = 0.010) (see Supplementary Tables S3, S4 for details).
eGFR Slope
The baseline (month 0) eGFR intercept for the T1low cohort was 39.9 mL/min/1.73 m2, while the T1high group had a baseline eGFR intercept that was 9.20 units lower (p = 0.096). Over time, the T1low group showed a slight, non-significant decline in eGFR at a rate of 0.06 mL/min/1.73 m2 per month (p = 0.63). In contrast, the T1high group experienced a significantly steeper decline, with an additional 0.41 units per month (p = 0.016) compared to the T1low group. This resulted in a total eGFR decline of 11.31 mL/min/1.73 m2 for the T1high group and 1.40 mL/min/1.73 m2 for the T1low group over 24 months (Figure 3).
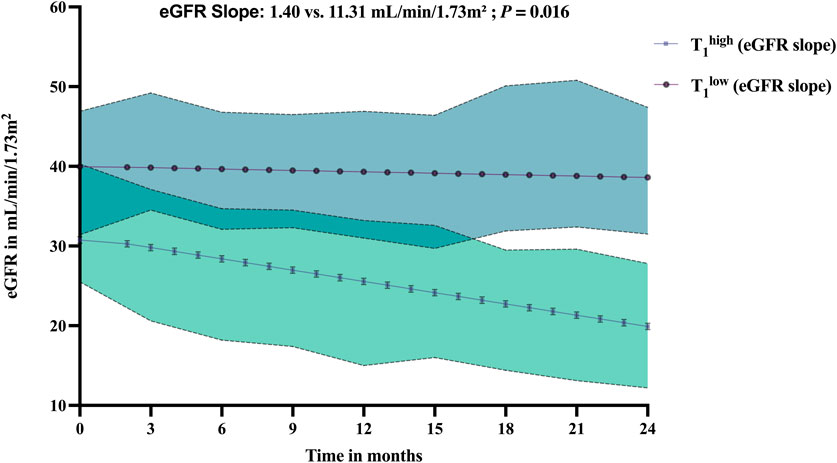
Figure 3. Comparative analysis of estimated glomerular filtration rate (eGFR) values (presented with 95% confidence intervals as shaded areas) over 24 months in kidney transplant recipients compared between the T1high and T1low groups. Abbreviations: eGFR, estimated glomerular filtration rate calculated with CKD-EPI equation, in mL/min/1.73 m2.
ROC Analysis
We used ROC analysis to assess if T1 can be used as a predictive marker for renal allograft loss (Figure 4). T1 above the median resulted in a PPV for predicting graft loss of 52.2% with an AUC of 0.75, p = 0.007. Conversely, the NPV was 91.3%. T1 demonstrated a sensitivity of 100% across the lower cutoff values, specifically from “>1,126 ms” to “>1,317 ms”. At the cutoff of “>1,317 ms”, the sensitivity slightly decreased to 92.9%, while the specificity saw a substantial increase, indicative of fewer false-positive results. At “>1,337 ms”, sensitivity is still 92.86%, but specificity has increased to 53.1%. At “>1,352 ms”, the sensitivity remained at 92.86%, and the specificity increased further to 62.5%. The analysis identifies T1 “>1,352” ms as an optimal cutoff point in our patient cohort for balancing sensitivity and specificity in a clinical setting.
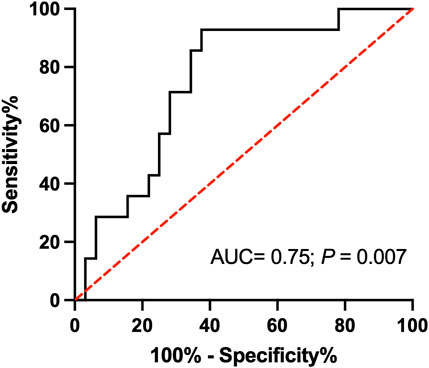
Figure 4. Receiver operating characteristic (ROC) analysis for T1 relaxation time and graft loss after 24 months of follow-up. Higher T1 values indicate a higher likelihood of graft loss. The optimal cutoff of “> 1,352 ms” provides the best balance for accurately identifying patients with an increased risk of graft loss. Abbreviation: AUC, area under the curve, ms: millisecond.
Survival Analysis and Kaplan-Meier Curve
The Kaplan-Meier survival analysis revealed significant differences in graft survival between the groups (Figure 5). After 12 months, all kidney transplants in the T1low group were still functioning, compared to 91.3% in the T1high group. This difference became more pronounced over time, with survival rates of 91.3% versus 60.9% at 21 months and 87.0% versus 52.2% after 24 months (Log-rank test, p = 0.0015, Figure 5). A T1 above the median was a significant risk factor for graft loss (HR 7.3, 95% CI: 2.6–21.0). The cortico-medullary difference of the T1 (ΔT1) was available in 32 patients. Patients without graft loss had a mean ΔT1 of −337.13 ms, while those with graft loss had a mean of −251.81 ms, with no significant differences (p = 0.417).
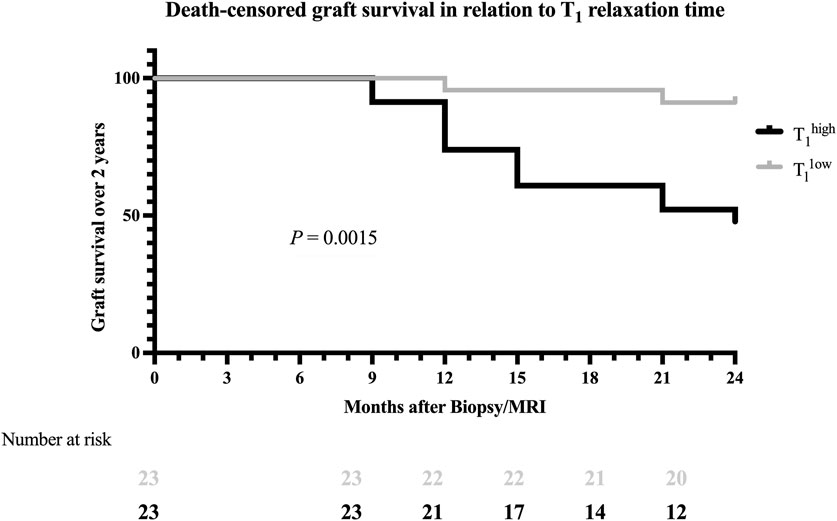
Figure 5. Kaplan-Meier survival curve for the death-censored graft survival analysis 24 months after study enrollment. The black line illustrates graft survival for T1high patients, and the grey line illustrates graft survival for T1low patients. Within the timeframe of 24 months, a significant difference in graft survival was found (Log-rank test: p = 0.0015).
Discussion
We had hypothesized that T1, as measured by MRI, could serve as a reliable non-invasive biomarker for predicting kidney allograft dysfunction. T1 mapping is an emerging tool to quantify high-grade interstitial fibrosis in renal allografts [11, 15, 25]. Yet, little is known about the prognostic relevance of T1, a prerequisite for broader use as a non-invasive surveillance tool.
As a major finding of our study, we were able to show that elevated cortical T1 not only correlates with histological markers for chronic lesions but can also predict worsening allograft function. Patients with T1 above the median had eGFR levels comparable to the T1low group at baseline but significantly worse graft function across all follow-up intervals. We further compared the predictive power with established markers of chronic allograft injury, such as interstitial fibrosis. The Z scores, ranging from −0.08 to 1.03, indicate that the correlation of T1 with eGFR levels is slightly lower than that of Banff ci across all time points. Yet, the magnitude of the Z scores suggests that these differences are small and not significant, highlighting the potential utility of T1 mapping as an accurate, non-invasive alternative to quantify chronic allograft injuries.
Similar results were previously published by Bane et al., where, as part of a multiparametric MRI, T1 and diffusion-weighted imaging (cortical ADC values) allowed good prediction of eGFR decline after 18 months [17]. Yet, in comparison to our study, only 12 patients with allograft dysfunction underwent biopsies, and those were performed at more variable time intervals. With the higher sample size and a longer follow-up period of our study, we were not only able to confirm the findings from Bane et al. but showed that also cortical T1 alone allows a decent prediction of graft function during midterm follow-ups. As the measurement of cortical T1 times alone is less time-demanding as a multiparametric protocol, it may further facilitate the implementation of MRI in post-transplant surveillance programs.
A previous study from Shi et al. reported that cortical T1 was associated with higher fibrosis and worse renal outcomes in native kidneys [26]. Interestingly, similar to the study from Shi et al., we observed that in some patients with the lowest Banff ci score (ci 0), cortical T1 was above our median split value. Whether this was due to sampling error in the biopsy or based on other factors influencing MRI results remains speculative [15, 25, 27]. In a previous study from Berchtold et al., it was shown that altered T1 might even precede the development of histological signs of chronic injury [28]. Besides chronic fibrosis, animal studies with ischemia-induced acute kidney injury showed that T1 also correlates with the degree of capillary leakage and both cellular and interstitial edema, essential components of acute local inflammation. Unfortunately, our subgroup of patients with ci 0 was too small to study this finding in more detail.
Moreover, our research gave insight into the prognostic implications of T1 through ROC analysis and Kaplan-Meier survival curves. The high NPV of T1 suggests that magneto-chemical alterations caused by morphological changes associated with deterioration of graft function are absent, and probability of short-term graft loss is low. Concurrently, the Kaplan-Meier analysis demonstrated a significant survival advantage for allografts with lower T1, further cementing the potential prognostic relevance of renal MRI in post-transplant care. A new aspect of our study was the exploration of eGFR slopes over time, the currently most endorsed method to quantify renal function declines [29].
Certain limitations in our study need to be addressed. We focused our analysis on T1 and did not include other MRI methods. On the other hand, we were able to show that even with one single MRI parameter, meaningful prognostic estimates are possible. The study’s sample size, while adequate for preliminary analysis, necessitates larger, multicenter trials to validate our findings across diverse populations and clinical settings. The use of the last observation carried forward (LOCF) method to address data discontinuity due to graft loss, while methodologically sound, may introduce a conservative bias, potentially underestimating the predictive power of T1. Additionally, the study’s reliance on a single MRI parameter, despite its advantageous application capabilities, might not capture the entirety of the post-transplant complexities. It is also noteworthy that a number of patients in the T1high group were diagnosed with antibody-mediated rejections in their biopsies, possibly indicating a more aggressive underlying disease. Whereas in the T1low group, pathologies with potentially benign outcomes such as BKPyVAN were found, our MRIs were performed between 2017 and 2019, a time before the emerging AMR treatments were available [30]. Results from our ROC analysis are based on a relatively high graft loss rate, especially in the T1high in our patient population. Yet, to apply our reported PPV and NPV values in an overall renal transplant cohort, further studies including more stable renal grafts (e.g., only protocol biopsies) may be necessary.
In conclusion, our study contributes to the growing field of renal transplant diagnostics by highlighting the prognostic value of T1. Yet, the adoption of MRI in routine post-transplant monitoring still hinges on considerations of cost, accessibility, and the standardization of imaging protocols [11, 31]. By demonstrating the potential to identify patients at high risk for midterm graft failure, we further add to the growing data, highlighting the potential utility of this non-invasive marker. Future research, encompassing larger cohorts and longitudinal studies, will be instrumental in integrating MRI into kidney transplant surveillance.
Data Availability Statement
The raw data supporting the conclusions of this article will be made available by the authors, upon reasonable request.
Ethics Statement
The studies involving humans were approved by Medical University of Vienna Institutional Review Board Nr. 1893/2017. The studies were conducted in accordance with the local legislation and institutional requirements. The participants provided their written informed consent to participate in this study.
Author Contributions
HO, ME, and FE have participated in the research design, research performance, and the writing of the manuscript. DB, MW, NK, GB, and AB-T. have contributed to data analysis and the writing of the manuscript. All authors contributed to the article and approved the submitted version.
Funding
The author(s) declare that no financial support was received for the research and/or publication of this article.
Conflict of Interest
The authors declare that the research was conducted in the absence of any commercial or financial relationships that could be construed as a potential conflict of interest.
Generative AI Statement
The author(s) declare that Generative AI was used in the creation of this manuscript. Two pictograms used in the graphical abstract were generated with the assistance of OpenAI’s ChatGPT, based on the GPT-4 model (version as provided by OpenAI at the time of use). These images were created to visually summarize key concepts in the manuscript. The AI-generated graphics were subsequently reviewed, refined, and adapted by the authors to ensure they accurately reflect the study’s content.
Supplementary Material
The Supplementary Material for this article can be found online at: https://www.frontierspartnerships.org/articles/10.3389/ti.2025.14301/full#supplementary-material
Abbreviations
AMR, antibody-mediated rejection; ADC, apparent diffusion coefficient; BKPyVAN, BK Polyomavirus associated nephropathy; ci, Banff score for interstitial fibrosis; ct, Banff score for tubular atrophy; cg, Banff score for double contours; cv, Banff score for vascular fibrous intimal thickening; DWI, diffusion-weighted imaging; HR, hazard ratio; GFR, glomerular filtration rate; IQR, interquartile range; LOCF, last observation carried forward; mo/mos, month/months; MRI, magnetic resonance imaging; ms, milliseconds; NPV, negative predictive value; PPV, positive predictive value; SD, standard deviation; TCMR, T cell-mediated rejection; TMA, thrombotic microangiopathy; Tx, transplantation.
References
1. Kidney Disease: Improving Global Outcomes KDIGO CKD Work Group. KDIGO 2024 Clinical Practice Guideline for the Evaluation and Management of Chronic Kidney Disease. Kidney Int (2024) 105(4s):S117–s314. doi:10.1016/j.kint.2023.10.018
2. Poggio, ED, McClelland, RL, Blank, KN, Hansen, S, Bansal, S, Bomback, AS, et al. Systematic Review and Meta-Analysis of Native Kidney Biopsy Complications. Clin J Am Soc Nephrol (2020) 15(11):1595–602. doi:10.2215/cjn.04710420
3. Morgan, TA, Chandran, S, Burger, IM, Zhang, CA, and Goldstein, RB. Complications of Ultrasound-Guided Renal Transplant Biopsies. Am J Transplant (2016) 16(4):1298–305. doi:10.1111/ajt.13622
4. Fang, J, Li, G, Xu, L, Zhang, L, Yin, W, Lai, X, et al. Complications and Clinical Management of Ultrasound-Guided Renal Allograft Biopsies. Transl Androl Urol (2019) 8(4):292–6. doi:10.21037/tau.2019.07.23
5. Redfield, RR, McCune, KR, Rao, A, Sadowski, E, Hanson, M, Kolterman, AJ, et al. Nature, Timing, and Severity of Complications from Ultrasound-Guided Percutaneous Renal Transplant Biopsy. Transpl Int (2016) 29(2):167–72. doi:10.1111/tri.12660
6. Schutter, R, Lantinga, VA, Borra, RJH, and Moers, C. MRI for Diagnosis of Post-renal Transplant Complications: Current State-Of-The-Art and Future Perspectives. Magma (2020) 33(1):49–61. doi:10.1007/s10334-019-00813-8
7. Friedli, I, Crowe, LA, Berchtold, L, Moll, S, Hadaya, K, de Perrot, T, et al. New Magnetic Resonance Imaging Index for Renal Fibrosis Assessment: A Comparison between Diffusion-Weighted Imaging and T1 Mapping with Histological Validation. Sci Rep (2016) 6:30088. doi:10.1038/srep30088
8. Beck-Tölly, A, Eder, M, Beitzke, D, Eskandary, F, Agibetov, A, Lampichler, K, et al. Magnetic Resonance Imaging for Evaluation of Interstitial Fibrosis in Kidney Allografts. Transpl Direct (2020) 6(8):e577. doi:10.1097/txd.0000000000001009
9. Berchtold, L, Friedli, I, Crowe, LA, Martinez, C, Moll, S, Hadaya, K, et al. Validation of the Corticomedullary Difference in Magnetic Resonance Imaging-Derived Apparent Diffusion Coefficient for Kidney Fibrosis Detection: A Cross-Sectional Study. Nephrol Dial Transpl (2020) 35(6):937–45. doi:10.1093/ndt/gfy389
10. Berchtold, L, Crowe, LA, Combescure, C, Kassaï, M, Aslam, I, Legouis, D, et al. Diffusion-Magnetic Resonance Imaging Predicts Decline of Kidney Function in Chronic Kidney Disease and in Patients with a Kidney Allograft. Kidney Int (2022) 101(4):804–13. doi:10.1016/j.kint.2021.12.014
11. Selby, NM, Blankestijn, PJ, Boor, P, Combe, C, Eckardt, KU, Eikefjord, E, et al. Magnetic Resonance Imaging Biomarkers for Chronic Kidney Disease: A Position Paper from the European Cooperation in Science and Technology Action PARENCHIMA. Nephrol Dial Transpl (2018) 33(Suppl. l_2):ii4–ii14. doi:10.1093/ndt/gfy152
12. Lee, VS, Rusinek, H, Noz, ME, Lee, P, Raghavan, M, and Kramer, EL. Dynamic Three-Dimensional MR Renography for the Measurement of Single Kidney Function: Initial Experience. Radiology (2003) 227(1):289–94. doi:10.1148/radiol.2271020383
13. Zhang, JL, Rusinek, H, Chandarana, H, and Lee, VS. Functional MRI of the Kidneys. J Magn Reson Imaging (2013) 37:282–93. doi:10.1002/jmri.23717
14. Schley, G, Jordan, J, Ellmann, S, Rosen, S, Eckardt, KU, Uder, M, et al. Multiparametric Magnetic Resonance Imaging of Experimental Chronic Kidney Disease: A Quantitative Correlation Study with Histology. PLoS One (2018) 13(7):e0200259. doi:10.1371/journal.pone.0200259
15. Wolf, M, de Boer, A, Sharma, K, Boor, P, Leiner, T, Sunder-Plassmann, G, et al. Magnetic Resonance Imaging T1-and T2-Mapping to Assess Renal Structure and Function: A Systematic Review and Statement Paper. Nephrol Dial Transpl (2018) 33(Suppl. l_2):ii41–ii50. doi:10.1093/ndt/gfy198
16. Wolf, M, Kommer, S, Fembek, S, Dröszler, U, Körner, T, Berg, A, et al. Reproducible Phantom for Quality Assurance in Abdominal MRI Focussing Kidney Imaging. Front Phys (2022) 10:993241. doi:10.3389/fphy.2022.993241
17. Bane, O, Hectors, SJ, Gordic, S, Kennedy, P, Wagner, M, Weiss, A, et al. Multiparametric Magnetic Resonance Imaging Shows Promising Results to Assess Renal Transplant Dysfunction with Fibrosis. Kidney Int (2020) 97(2):414–20. doi:10.1016/j.kint.2019.09.030
18. Heusch, P, Wittsack, HJ, Blondin, D, Ljimani, A, Nguyen-Quang, M, Martirosian, P, et al. Functional Evaluation of Transplanted Kidneys Using Arterial Spin Labeling MRI. J Magn Reson Imaging (2014) 40(1):84–9. doi:10.1002/jmri.24336
19. Hueper, K, Gueler, F, Bräsen, JH, Gutberlet, M, Jang, MS, Lehner, F, et al. Functional MRI Detects Perfusion Impairment in Renal Allografts with Delayed Graft Function. Am J Physiol Ren Physiol (2015) 308(12):F1444–51. doi:10.1152/ajprenal.00064.2015
20. Berchtold, L, Crowe, LA, Friedli, I, Legouis, D, Moll, S, de Perrot, T, et al. Diffusion Magnetic Resonance Imaging Detects an Increase in Interstitial Fibrosis Earlier Than the Decline of Renal Function. Nephrol Dial Transplant (2020) 35(7):1274–6. doi:10.1093/ndt/gfaa007
21. Wu, J, Shi, Z, Zhang, Y, Yan, J, Shang, F, Wang, Y, et al. Native T1 Mapping in Assessing Kidney Fibrosis for Patients with Chronic Glomerulonephritis. Front Med (Lausanne) (2021) 8:772326. doi:10.3389/fmed.2021.772326
22. Wei, C-G, Zeng, Y, Zhang, R, Zhu, Y, Tu, J, Pan, P, et al. Native T1 Mapping for Non-Invasive Quantitative Evaluation of Renal Function and Renal Fibrosis in Patients with Chronic Kidney Disease. Quantitative Imaging Med Surg (2023) 13(8):5058–71. doi:10.21037/qims-22-1304
23. Haas, M, Loupy, A, Lefaucheur, C, Roufosse, C, Glotz, D, Seron, D, et al. The Banff 2017 Kidney Meeting Report: Revised Diagnostic Criteria for Chronic Active T Cell-Mediated Rejection, Antibody-Mediated Rejection, and Prospects for Integrative Endpoints for Next-Generation Clinical Trials. Am J Transpl (2018) 18(2):293–307. doi:10.1111/ajt.14625
24. Haas, M, Mirocha, J, Huang, E, Najjar, R, Peng, A, Sethi, S, et al. A Banff-Based Histologic Chronicity Index Is Associated with Graft Loss in Patients with a Kidney Transplant and Antibody-Mediated Rejection. Kidney Int (2023) 103(1):187–95. doi:10.1016/j.kint.2022.09.030
25. Dekkers, IA, de Boer, A, Sharma, K, Cox, EF, Lamb, HJ, Buckley, DL, et al. Consensus-Based Technical Recommendations for Clinical Translation of Renal T1 and T2 Mapping MRI. Magma (2020) 33(1):163–76. doi:10.1007/s10334-019-00797-5
26. Shi, Z, Sun, C, Zhou, F, Yuan, J, Chen, M, Wang, X, et al. Native T1-Mapping as a Predictor of Progressive Renal Function Decline in Chronic Kidney Disease Patients. BMC Nephrol (2024) 25(1):121. doi:10.1186/s12882-024-03559-1
27. Sorof, JM, Vartanian, RK, Olson, JL, Tomlanovich, SJ, Vincenti, FG, and Amend, WJ. Histopathological Concordance of Paired Renal Allograft Biopsy Cores. Effect on the Diagnosis and Management of Acute Rejection. Transplantation (1995) 60(11):1215–9. doi:10.1097/00007890-199512000-00007
28. Hueper, K, Peperhove, M, Rong, S, Gerstenberg, J, Mengel, M, Meier, M, et al. T1-Mapping for Assessment of Ischemia-Induced Acute Kidney Injury and Prediction of Chronic Kidney Disease in Mice. Eur Radiol (2014) 24(9):2252–60. doi:10.1007/s00330-014-3250-6
29. Inker, LA, Collier, W, Greene, T, Miao, S, Chaudhari, J, Appel, GB, et al. A Meta-Analysis of GFR Slope as a Surrogate Endpoint for Kidney Failure. Nat Med (2023) 29(7):1867–76. doi:10.1038/s41591-023-02418-0
30. Mayer, KA, Schrezenmeier, E, Diebold, M, Halloran, PF, Schatzl, M, Schranz, S, et al. A Randomized Phase 2 Trial of Felzartamab in Antibody-Mediated Rejection. N Engl J Med (2024) 391(2):122–32. doi:10.1056/NEJMoa2400763
Keywords: kidney transplantation, T1 relaxation time, allograft dysfunction, non-invasive, biomarkers
Citation: Omić H, Eskandary F, Beitzke D, Wolf M, Kozakowski N, Böhmig G, Beck-Tölly A and Eder M (2025) T1 Relaxation Time for the Prediction of Renal Transplant Dysfunction. Transpl. Int. 38:14301. doi: 10.3389/ti.2025.14301
Received: 05 January 2025; Accepted: 24 March 2025;
Published: 10 April 2025.
Copyright © 2025 Omić, Eskandary, Beitzke, Wolf, Kozakowski, Böhmig, Beck-Tölly and Eder. This is an open-access article distributed under the terms of the Creative Commons Attribution License (CC BY). The use, distribution or reproduction in other forums is permitted, provided the original author(s) and the copyright owner(s) are credited and that the original publication in this journal is cited, in accordance with accepted academic practice. No use, distribution or reproduction is permitted which does not comply with these terms.
*Correspondence: Michael Eder, bWljaGFlbC5lZGVyQG1lZHVuaXdpZW4uYWMuYXQ=