Abstract
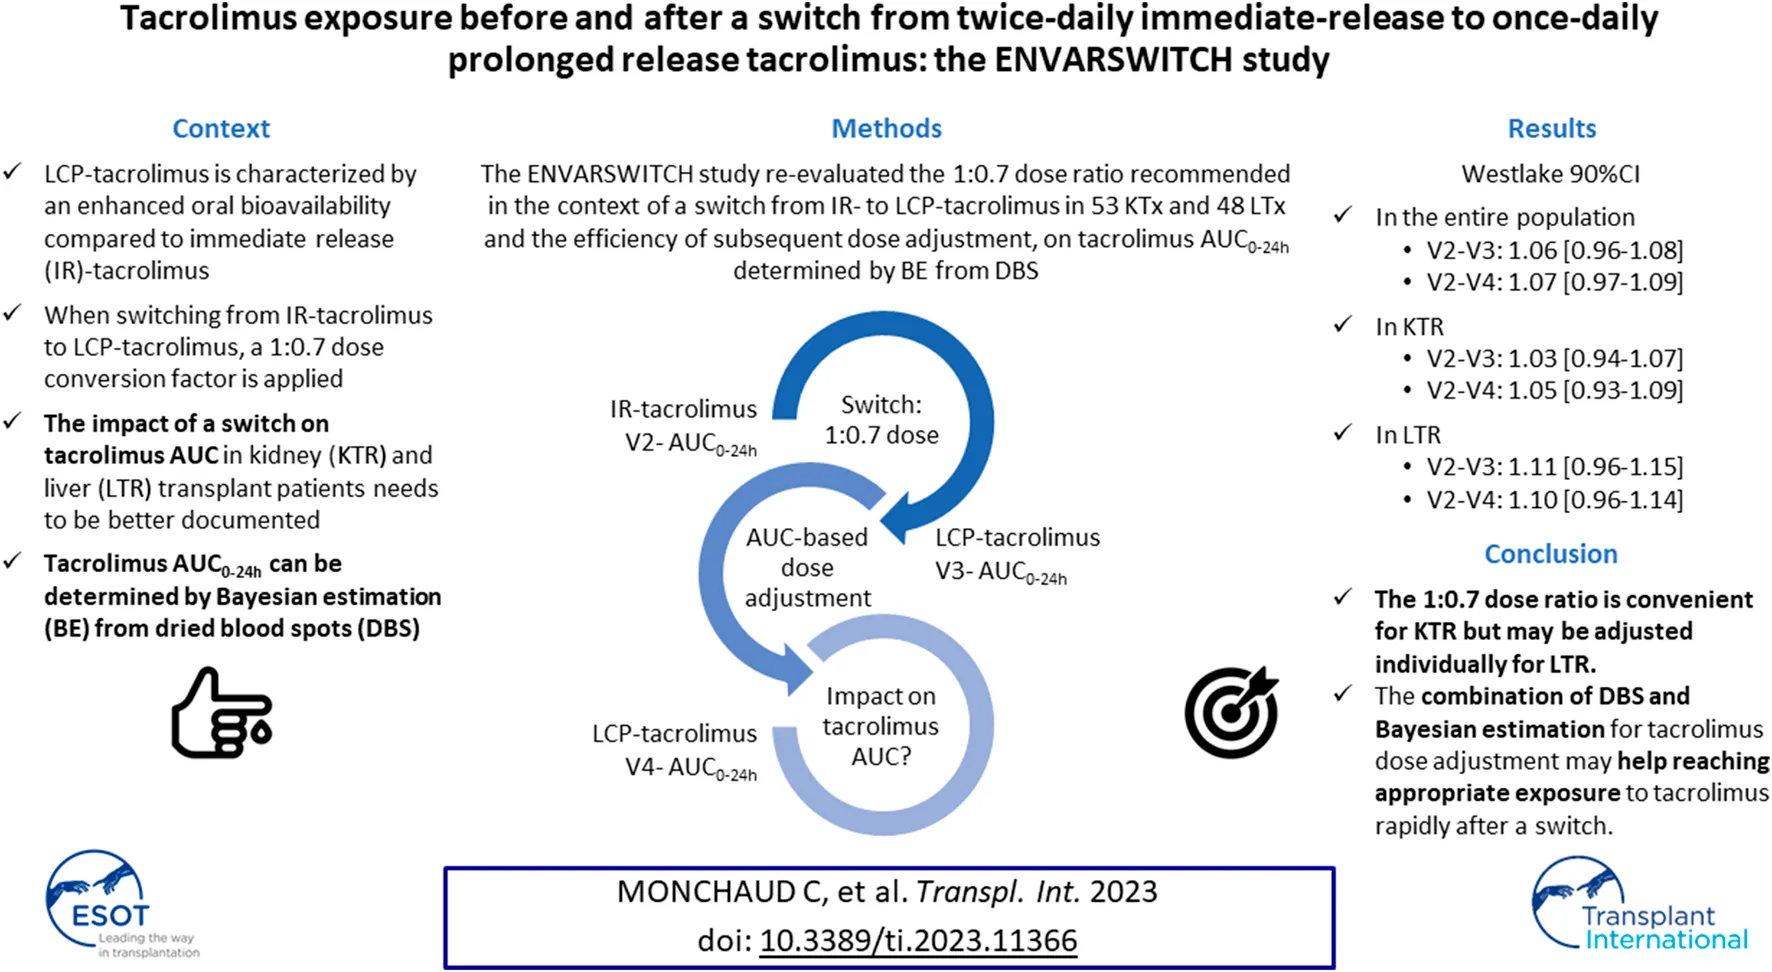
LCP-tacrolimus displays enhanced oral bioavailability compared to immediate-release (IR-) tacrolimus. The ENVARSWITCH study aimed to compare tacrolimus AUC0–24 h in stable kidney (KTR) and liver transplant recipients (LTR) on IR-tacrolimus converted to LCP-tacrolimus, in order to re-evaluate the 1:0.7 dose ratio recommended in the context of a switch and the efficiency of the subsequent dose adjustment. Tacrolimus AUC0–24 h was obtained by Bayesian estimation based on three concentrations measured in dried blood spots before (V2), after the switch (V3), and after LCP-tacrolimus dose adjustment intended to reach the pre-switch AUC0–24 h (V4). AUC0–24 h estimates and distributions were compared using the bioequivalence rule for narrow therapeutic range drugs (Westlake 90% CI within 0.90–1.11). Fifty-three KTR and 48 LTR completed the study with no major deviation. AUC0–24 h bioequivalence was met in the entire population and in KTR between V2 and V4 and between V2 and V3. In LTR, the Westlake 90% CI was close to the acceptance limits between V2 and V4 (90% CI = [0.96–1.14]) and between V2 and V3 (90% CI = [0.96–1.15]). The 1:0.7 dose ratio is convenient for KTR but may be adjusted individually for LTR. The combination of DBS and Bayesian estimation for tacrolimus dose adjustment may help with reaching appropriate exposure to tacrolimus rapidly after a switch.
Introduction
The pharmacokinetics of LCP-tacrolimus (Envarsus®) has been sparsely investigated [1], and clinical trials [2–5] have left some uncertainty on the exact starting dose, dose ratio with regards to other prolonged-release formulations, and blood levels to be expected in kidney (KTR) and liver transplant recipients (LTR). Previous experience with Advagraf® showed that absorption could be almost nil in the first days post-transplantation, and that in stable patients, the 1:1 dose ratio resulted in lower C0 but comparable AUC0–24 h [6].
The relationship between tacrolimus exposure and effects renders individual dose adjustment essential to avoid under- or overexposure [7]. The exposure index best associated with clinical effects is the area under the concentration–time curve (AUC) [7]. To overcome the inconveniences of collecting 10–12 blood samples over the dose interval, Bayesian estimators based on sparse sampling strategies have been developed for the AUC estimation of all tacrolimus formulations [1, 8–12] and are routinely used through the ISBA expert system1 [13]. However, the collection of several blood samples by venipuncture in a medical environment induces costs and logistical constraints. Therefore, dried blood spot (DBS) sampling, which can easily be performed at home, has been proposed for the therapeutic drug monitoring (TDM) of tacrolimus [14–20]. After a fingerprick, blood is applied onto a special filter paper, which is subsequently mailed to the laboratory. Good acceptability by the patients [21] and reliability of measured drug levels [16–20] are arguments in favor of DBS for the TDM of tacrolimus in transplantation. Furthermore, DBS are particularly suited to LCP-tacrolimus for which the optimal sampling times for AUC0–24 h estimation are 0, 8, and 12 h post-dose [1].
In this context, we hypothesized that implementing DBS home sampling for the Bayesian estimation of tacrolimus AUC0–24 h before and after a conversion, and considering the pre-switch AUC0–24 h as a reference for LCP-tacrolimus dose adjustment after the switch, would allow maintaining of tacrolimus AUC0–24 h. Therefore, the aims of the ENVARSWITCH study were to verify, in KTR and LTR, the equivalence of the AUC0–24 h values before and after a switch from IR-tacrolimus to LCP-tacrolimus at a 1:0.7 dose, followed by individual dose adjustment targeting the pre-switch AUC0–24 h. The study also aimed to compare tacrolimus exposure indices (AUC0–24 h, Cmax and C0) before vs. after the switch, before and after dose adjustment.
Patients and Methods
Study Design, Patients and Procedures
The ENVARSWITCH study (EudraCT number: 2016-001014-22) was a multicenter prospective open clinical study conducted in 16 French transplantation centres, in accordance with the Declaration of Helsinki, Good Clinical Practice and the International Conference on Harmonization (ICH) guidelines. The protocol received approval from the Independent Ethics Committee (ref. CPP16-022/2016-001014-22) and authorization from the French National Agency for Medicines and Health Products Safety (ref. 160372A-11). All enrolled patients gave their written informed consent.
The primary objective was to verify the absence of difference between pre- and post-switch tacrolimus AUC0–24 h calculated by Bayesian estimation, in KTR and LTR switched from IR-tacrolimus (Prograf®) to LCP-tacrolimus (Envarsus®) at a 1:0.7 dose, possibly followed by individual dose adjustment targeting the pre-switch AUC0–24 h.
We enrolled adult (≥18 year-old) kidney and liver transplant recipients, transplanted for between 2 weeks and 1 year, in whom a switch from IR-tacrolimus to LCP-tacrolimus had been decided, and in whom the IR-tacrolimus dose had been unchanged for at least 1 week or since the last two C0 measurements. At the first protocol visit (V1), tacrolimus C0 had to be between 4 and 12 μg/L and hematocrit >0.27.
After inclusion, real-time Bayesian estimation of AUC0–24 h was performed (Figure 1): on the day before the switch (V2), after the IR-tacrolimus morning and evening doses (two AUC0–12 h estimations); 2–4 days after the switch (V3); 7–14 days after V3 (V4). Conversion from IR-tacrolimus to LCP-tacrolimus was done on a 1:0.7 (mg:mg) total daily dose basis. Further dose adjustment could be performed between days 7 and 9, according to the AUC0–24h estimated at V3, to target the pre-switch AUC0–24 h calculated by summing the morning and the evening tacrolimus AUC0–12 h. AUC0–24 h at V4 was compared to the individual target AUC0–24 h (V2). No standardized AUC0–24 h target was considered for the study.
FIGURE 1
Tacrolimus AUC Determination
AUC0–24 h was obtained by Bayesian estimation and a limited sampling strategy (pre-dose then 1 h and 3 h post-dose for IR-tacrolimus; pre-dose and 8 h then 12 h post-dose for LCP-tacrolimus) [1, 8, 10]. DBS were collected on Whatman™ 903 protein saver cards. At V2, the study nurses collected the DBS necessary for the determination of IR-tacrolimus morning AUC0–12 h and trained the patients to collect DBS autonomously. Afterwards, DBS collection was performed at home by the patients. DBS were post-mailed within 24 h after sampling to Limoges University Hospital for centralized analysis. Tacrolimus concentrations were determined using a high performance liquid chromatography–tandem mass spectrometry method on a 4500 AB-Sciex system (Forster City, CA, United States) validated in accordance with the IATDMCT recommendations [22], covering a concentration range of 1–100 μg/L. AUC estimation and the recommended dose were transmitted to the clinicians via a dedicated website within 24 h following DBS reception (maximum 5 days).
Endpoints
The primary endpoint was the Westlake 90%-confidence interval (CI) of the ratio of the dose-adjusted LCP-tacrolimus steady-state AUC0–24 h (V4) over the pre-switch IR-tacrolimus steady-state AUC0–24 h (V2) after log-transformation, in the entire population.
Secondary endpoints were the Westlake 90%-CI of the ratio of AUC0–24 h at V4 over AUC0–24 h at V2 in KTR and in LTR patients and the differences in and ratios of AUC0–24 h, Cmax and C0 between V2 and V3 in each subgroup.
Renal function was assessed as serum creatinine (SCr) and glomerular filtration rate estimated using the CKD-EPI equation [23]. For regulatory reasons, whenever missing, the eGFR was estimated from SCr by applying the CKD-EPI equation and considering the individuals as “not Black,” since there was a very high probability for patients to be of Caucasian or North-African ancestry.
Post hoc analyses were performed to examine, in the entire population and in each subgroup: 1) the correlation between the theoretical LCP-tacrolimus dose (calculated by applying the 1:0.7 ratio) and the actual dose at V3; 2) the correlation between the LCP-tacrolimus dose proposed after V3 and the actual dose at V4. Doses and exposure indices were also compared between subgroups and periods.
Adverse Events (AEs)
All AEs occurring between enrollment and the end of the trial were recorded on an ongoing basis, regardless of whether they were related or not to IR-tacrolimus or LCP-tacrolimus. Seriousness was assessed according to ICH E2A [24] and severity (mild, moderate, severe) according to its impact on activities of daily life. The causality to the investigational drug was independently assessed by the investigator and the sponsor (worst causality) at the time of the event. All AEs were coded using the MedDRA dictionary (version 23.0).
Statistical Analyses
Statistical analyses were performed using R version 4.0 (R Project for Statistical Computing: 2). Categorical data are reported as frequencies and percentages, continuous data as means ± standard deviations (SD). Continuous variables were compared between periods using Student paired-t test.
Data were analyzed for the intent-to-treat population (Full Analysis Set, FAS; KTR and LTR, referred to as “the entire population”) and for the per-protocol set (PPS). The FAS comprised included patients who complied with all study visits, while the PPS was restricted to patients of the FAS with no critical protocol deviation. Unless stated, all results are based on the FAS. Safety analyses were based on all included patients.
The comparison of AUC0–24 h between V2 and subsequent visits was based on the mean ratios between log-transformed AUC0–24 h and their Westlake 90%-CI. AUC0–24 h between visits were deemed bioequivalent if the Westlake 90%-CI fell within the 0.90–1.11 range defined by the European Medicine Agency for the bioequivalence of drugs with a narrow therapeutic index [25–28].
The comparison of the exposure indices between the three periods was done by computing Pearson’s coefficient tests, and calculating the mean relative difference and root mean square error (RMSE) of exposure indices at V3 and V4 with respect to those measured at V2.
Sample Size
It was estimated that 96 patients would demonstrate a mean ratio of 1 [90%CI within 0.90–1.11] between V4 and V2 log-transformed AUC0–24 h, with an expected coefficient of variation = 25% for tacrolimus AUC0–24 h and 80% power. Anticipating that 10% patients may not meet the requirements of tacrolimus C0 between 4 and 12 μg/L and hematocrit >0.27, and that 20% may drop out (including missing or poor DBS collection or analysis), the total number of patients to enroll was set to 134.
Results
Patients
Overall, 134 patients (70 KTR and 64 LTR) were enrolled. Three patients did not meet the inclusion criteria at V1 and 30 either discontinued study participation or displayed unexploitable AUC0–24 h at V2 (Figure 2). Thus, the FAS comprised 101 patients, of whom 75 constituted the PPS. The KTR and LTR subgroups (Table 1) were comparable in terms of sex ratio, weight, body mass index and haematocrit, but LTR were characterized by a significantly older age (p = 0.001), later post-transplantation period (p = 0.002), and better kidney function (p = 0.022 for SCr and <0.001 for eGFR).
FIGURE 2
TABLE 1
| Variables | Full analysis set | Per protocol set | ||||
|---|---|---|---|---|---|---|
| Total | Kidney transplant patients | Liver transplant patients | Total | Kidney transplant patients | Liver transplant patients | |
| N = 101 | N = 53 | N = 48 | N = 75 | N = 38 | N = 37 | |
| Age, years | 53.2 (11.9) | 49.6 (13.2) | 57.4 (8.80) | 53.8 (12.0) | 49.0 (13.4) | 58.7 (7.93) |
| Gender (M/F) | 70/31 | 32/21 | 38/10 | 52/23 | 23/15 | 29/8 |
| Post-transplantation time, days | 138 (91.8) | 112 (87.7) | 168 (87.9) | 137 (90.0) | 107 (83.8) | 167 (86.9) |
| Weight, kg | 74.7 (15.3) | 75.2 (14.3) | 74.1 (16.4) | 75.3 (15.8) | 75.9 (14.8) | 74.7 (16.9) |
| Body mass index, kg/m2 | 25.4 (4.41) | 25.2 (4.01) | 25.5 (4.84) | 25.3 (4.64) | 25.1 (4.16) | 25.6 (5.11) |
| Serum creatinine, µmol/L | 118 (51.2) | 129 (32.0) | 106 (64.5) | 121 (56.4) | 130 (34.4) | 112 (71.8) |
| eGFR (CKD-EPI), mL/min/1.73 m2a | 62.3 (21.1) | 53.4 (16.1) | 72.1 (21.7) | 60.8 (20.4) | 53.6 (17.0) | 68.2 (21.2) |
| Tacrolimus total daily dose, mg | 6.36 (4.12) | 7.75 (4.49) | 4.81 (3.03) | 6.03 (3.62) | 7.63 (3.75) | 4.39 (2.64) |
| Tacrolimus C0, µg/L | 7.97 (2.01) | 8.58 (1.60) | 7.31 (2.21) | 7.90 (1.93) | 8.55 (1.60) | 7.26 (2.04) |
| Hematocrit, % | 37.1 (5.03) | 36.8 (4.85) | 37.5 (5.25) | 37.0 (4.97) | 36.8 (5.00) | 37.2 (5.00) |
Patient characteristics at V2.
Data are presented as mean (SD).
eGFR considering patients as Caucasians: in FAS, n = 35 (22 KTx, 13 LTx); in PPS, n = 28 (17 KTx, 11 LTx).
Bold characters are for totals.
Tacrolimus Dose and Exposure Indices
AUC0–24 were distributed normally (Shapiro-Wilk test p between 0.067 and 0.2195). At V2, the mean IR-tacrolimus daily dose was significantly higher in KTR than in LTR (p < 0.001; Table 2), and so were C0 and AUC0–24 h (p < 0.001) (Table 1). The difference on daily dose and AUC0–24 h of LCP-tacrolimus between KTR and LTR persisted at V4 (p = 0.001 and p < 0.001, respectively).
TABLE 2
| Total | Kidney transplant patients | Liver transplant patients | ||
|---|---|---|---|---|
| N = 101 | N = 53 | N = 48 | ||
| V2 | Tacrolimus daily dose | 6.36 (4.12) | 7.75 (4.49) | 4.81 (3.03) |
| Before conversion | AUC0–24 h | 229 (77.2) | 266 (70.5) | 187 (61.9) |
| V3 | Tacrolimus daily dose | 4.43 (2.87) | 5.51 (3.25) | 3.22 (1.73) |
| After conversion | AUC0–24 h | 237 (88.6) | 273 (89.1) | 198 (70.3) |
| V4 | Tacrolimus daily dose | 4.48 (3.32) | 5.63 (3.81) | 3.22 (2.06) |
| After dose adjustment | AUC0–24 h | 236 (84.0) | 269 (72.2) | 200 (82.1) |
Tacrolimus daily dose (mg/day) and AUC0–24 h (h.µg/L) at each study visit in the full analysis set.
Data are presented as mean (SD).
Bold characters are for totals.
Evaluation of the Overall Dose-Conversion and Individual Dose-Adjustment Strategy
The bioequivalence criterion between V2 and V4 was met in the FAS (mean ratio [90% CI] = 1.07 [0.97–1.09]) and the PPS (1.08 [0.97–1.11]). The violin plots of AUC0–24h by subgroup at V2 and V4 in the FAS are presented in Figure 3. No significant difference was observed on the mean AUC0–24 h between V2 and V4 (p = 0.297), but correlation was poor (r = 0.608), with a mean relative difference between V4 and V2 of 0.074 ± 0.330 h.µg/L and RMSE = 34%.
FIGURE 3
The bioequivalence criterion between V2 and V4 was met in KTR (1.05 [0.93–1.09]) and almost met in LTR (1.10 [0.96–1.14]). The correlation between V2 and V4 AUC0–24h was poor in both subgroups (r = 0.462 and 0.571, respectively), and even poorer for C0 (r = 0.100 and 0.429) (Figure 4). No statistically significant C0 difference was observed between V2 and V4 for either subgroup (C0 = 7.87 ± 2.60 vs. 8.14 ± 2.41, p = 0.671 and 5.71 ± 2.12 μg/L vs. 6.33 ± 3.14 μg/L, p = 0.150, respectively).
FIGURE 4
Evaluation of the Recommended Dose-Conversion Ratio
The bioequivalence criterion between V2 and V3 was met in the entire population (1.06 [0.96–1.08]) and in KTR (1.03 [0.94–1.07]), but not in LTR (1.11 [0.96–1.15]). The correlation between V2 and V3 AUC0–24 h was poor in both subgroups (r = 0.724 and 0.531, respectively). Additionally, despite the absence of significant C0 differences between V2 and V3 in either subgroup (7.87 ± 2.60 vs. 7.72 ± 2.53 μg/L, p = 0.680 and 5.71 ± 2.12 vs. 6.30 ± 2.51 μg/L, p = 0.120, respectively), the correlation between V2 and V3 C0 was poorer than that of the AUC0–24 h (r = 0.516 and 0.391, respectively) (Figure 4). As expected, the mean Cmax was significantly lower at V3 than at V2 in both subgroups (15.6 ± 5.60 vs. 22.1 ± 9.42 μg/L, p < 0.001 and 11.4 ± 3.99 vs. 16.1 ± 6.69 μg/L, p < 0.001, respectively).
Compliance With the Recommended Dose
Correlations between the IR-tacrolimus dose at V2 × 0.7 and the LCP-tacrolimus dose at V3, and between the LCP-tacrolimus dose proposed at V3 and the administered dose at V4 were strong in both subgroups (r > 0.9, Figure 5), showing overall good compliance of the clinicians with the doses recommended at all steps.
FIGURE 5
Impact of Dose Adjustment on AUC0–24 h
The impact of dose adjustment on AUC0–24h was evaluated by comparing AUC0–24 h V4 vs. V2 depending on whether the patients needed dose adjustment after V3 (88 patients) or not (13 patients) and whether dose adjustment was done (53 patients) or not (35 patients) (Figure 6). No patient benefited from a dose adjustment if no dose adjustment had been proposed. The AUC0–24 h at V4 and V2 were well correlated in KTR who did not require and did not have a dose adjustment (r = 0.982), but not in LTR in the same situation (r = 0.225). In contrast, among patients for whom we proposed dose adjustment, the correlation was poor in KTR, whether dose adjustment had been applied or not (r = 0.458 and 0.356, respectively) and fair in LTR recipients (r = 0.581 and 0.794, respectively).
FIGURE 6
Renal Function
No difference in renal function was found between V2 and V4 in the entire population (Scr at V4 = 119 ± 50.2 μmol/L, p = 0.826; eGFR = 62.5 ± 22.3 mL/min, p = 0.974), nor in subgroups separately. The average SCr and eGFR at V4 were, respectively 130 ± 30.0 μmol/L (p = 0.953) and 53.4 ± 16.0 mL/min (p = 0.708) in KTR and 107 ± 63.0 μmol/L (p = 0.780) and 72.4 ± 24.0 mL/min (p = 0.818) in LTR.
Safety
The safety analysis set comprised the 134 patients enrolled (Table 3). Patients were on IR-tacrolimus for a maximum of 7 days and on LCP-tacrolimus for a maximum of 3 weeks during their participation in the study. Nineteen and fifty AEs occurred respectively while on IR-tacrolimus and LCP-tacrolimus. Eleven patients (8.2%) experienced at least one AE while on IR-tacrolimus and 33 (25.8%) while on LCP-tacrolimus. One patient (0.7%) while on IR-tacrolimus and twelve (9.4%) while on LCP-tacrolimus experienced at least one AE considered as possibly related to tacrolimus. The majority of AEs were of mild-to-moderate severity (100% on IR-tacrolimus and 94% on LCP-tacrolimus). The incidence of tremor, diarrhea, and hyperglycemia on LCP-tacrolimus was respectively 3.1%, 1.6%, and 0.8%.
TABLE 3
| IR-tacrolimus | LCP-tacrolimus | |||||
|---|---|---|---|---|---|---|
| AEs n (%) | Patients na (%) | AEs n (%) | Patients na (%) | |||
| N = 19 | N = 134 | N = 50 | N = 128 | |||
| Number of patients with at least one AE | 11 (8.2) | 33 (23.8) | ||||
| Number of patients with at least one serious AEs | 0 | 0 | 3 (6.0) | 3 (2.3) | ||
| Severity | ||||||
| Mild | 12 (63.2) | 8 (6.0) | 24 (48.0) | 18 (14.1) | ||
| Moderate | 7 (36.8) | 4 (3.0) | 23 (46.0) | 16 (12.5) | ||
| Severe | 0 | 0 | 3 (6.0) | 3 (2.3) | ||
| MedDRA classification (System Organ Class and Preferred Terms)b | ||||||
| Blood and Lymphatic System Disorders | ||||||
| Anemia | 1 (5.3) | 1 (0.7) | 1 (2.0) | 1 (0.8) | ||
| Bicytopenia | — | — | 1 (2.0) | 1 (0.8) | ||
| Leukopenia | 2 (10.5) | 2 (1.5) | — | — | ||
| Lymphopenia | — | — | 1 (2.0) | 1 (0.8) | ||
| Neutropenia | 1 (5.3) | 1 (0.7) | — | — | ||
| Eye Disorders | ||||||
| Retinal detachment | — | — | 1 (2.0) | 1 (0.8) | ||
| Gastrointestinal Disorders | ||||||
| Abdominal pain | — | — | 2 (4.0) | 2 (1.6) | ||
| Constipation | 1 (5.3) | 1 (0.7) | — | — | ||
| Diarrhea | — | — | 2 (4.0) | 2 (1.6) | ||
| Dyspepsia | 1 (5.3) | 1 (0.7) | 1 (2.0) | 1 (0.8) | ||
| Gastrointestinal motility disorder | — | 1 (2.0) | 1 (0.8) | |||
| Gastroesophageal reflux disease | 1 (5.3) | 1 (0.7) | — | — | ||
| Hemorrhoids | 1 (5.3) | 1 (0.7) | — | — | ||
| Mucous stools | — | — | 1 (2.0) | 1 (0.8) | ||
| General Disorders and Administration Site Conditions | ||||||
| Fatigue | 2 (10.5) | 2 (1.5) | 1 (2.0) | 1 (0.8) | ||
| Edema peripheral | 1 (5.3) | 1 (0.7) | — | — | ||
| Hepatobiliary Disorders | ||||||
| Jaundice | — | — | 1 (2.0) | 1 (0.8) | ||
| (severe) | ||||||
| Infections and Infestations | ||||||
| Cytomegalovirus gastrointestinal infection | — | — | 1 (2.0) | 1 (0.8) | ||
| Influenza | — | — | 1 (2.0) | 1 (0.8) | ||
| Sinusitis | — | — | 1 (2.0) | 1 (0.8) | ||
| Investigations | ||||||
| Alanine aminotransferase increased | — | — | 1 (2.0) | 1 (0.8) | ||
| BK polyomavirus test positive | — | — | 1 (2.0) | 1 (0.8) | ||
| Blood creatinine increased | 1 (5.3) | 1 (0.7) | 3 (6.0) | 3 (2.3) | ||
| Blood phosphorus decreased | 2 (10.5) | 2 (1.5) | — | — | ||
| Immunosuppressant drug level decreased | — | — | 1 (2.0) | 1 (0.8) | ||
| (severe) | ||||||
| Immunosuppressant drug level increased | — | — | 2 (4.0) | 2 (1.6) | ||
| Metabolism and Nutrition Disorders | ||||||
| Hypercalcemia | 1 (5.3) | 1 (0.7) | — | — | ||
| Hyperglycemia | — | — | 1 (2.0) | 1 (0.8) | ||
| Iron deficiency | — | — | 1 (2.0) | 1 (0.8) | ||
| Vitamin D deficiency | 1 (5.3) | 1 (0.7) | — | — | ||
| Musculoskeletal and Connective Tissue Disorders | ||||||
| Back pain | 1 (5.3) | 1 (0.7) | — | — | ||
| Tendonitis | — | — | 1 (2.0) | 1 (0.8) | ||
| Nervous System Disorders | ||||||
| Headache | — | — | 1 (2.0) | 1 (0.8) | ||
| Neuropathy peripheral | — | — | 1 (2.0) | 1 (0.8) | ||
| Sciatica | — | — | 1 (2.0) | 1 (0.8) | ||
| Tremor | 1 (5.3) | 1 (0.7) | 4 (8.0) | 4 (3.1) | ||
| (1 severe) | ||||||
| Psychiatric Disorders | ||||||
| Anxiety | — | — | 1 (2.0) | 1 (0.8) | ||
| Irritability | — | — | 1 (2.0) | 1 (0.8) | ||
| Nightmare | — | — | 1 (2.0) | 1 (0.8) | ||
| Renal and Urinary Disorders | ||||||
| Hematuria | — | — | 1 (2.0) | 1 (0.8) | ||
| Pollakiuria | — | — | 1 (2.0) | 1 (0.8) | ||
| Renal failure | — | — | 1 (2.0) | 1 (0.8) | ||
| Urine abnormality | — | — | 1 (2.0) | 1 (0.8) | ||
| Reproductive System and Breast Disorders | ||||||
| Testicular swelling | — | — | 1 (2.0) | 1 (0.8) | ||
| Respiratory, Thoracic and Mediastinal Disorders | ||||||
| Cough | — | — | 1 (2.0) | 1 (0.8) | ||
| Lung disorder | — | — | 1 (2.0) | 1 (0.8) | ||
| Wheezing | — | — | 1 (2.0) | 1 (0.8) | ||
| Skin and Subcutaneous Tissue Disorders | ||||||
| Pruritus | — | — | 2 (4.0) | 2 (1.6) | ||
| Surgical and Medical Procedures | ||||||
| Eventration repair | — | — | 1 (2.0) | 1 (0.8) | ||
| Vascular Disorders | ||||||
| Blood pressure inadequately controlled | — | — | 1 (2.0) | 1 (0.8) | ||
| Hot flush | — | — | 1 (2.0) | 1 (0.8) | ||
| Hypotension | 1 (5.3) | 1 (0.7) | — | — | ||
| Total | 19 | 50 | ||||
Incidence of adverse events (AE) by system organ class and for each treatment in the safety analysis set.
Patients with ≥2 AEs in the same preferred term are counted only once for that preferred term.
MedDRA version 23.0.
Bold characters are for totals.
Three serious AEs occurred in three patients, among which two were related to tacrolimus: one pneumopathy and one sub-therapeutic dosage. This latter AE occurred in a patient who had subtotal colectomy, resulting in a decreased AUC0-24 at V3 confirmed by a low C0 value, explained by the lower absorption of tacrolimus in its extended-release formulation. The patient was switched back to IR-tacrolimus and excluded from the study.
Discussion
ENVARSWITCH confirms bioequivalent exposure to tacrolimus in terms of AUC0–24 h in 101 stable KTR or LTR converted from IR-tacrolimus to LCP-tacrolimus using a 1:0.7 dose ratio. It is the first clinical study proposing the combination of DBS and Bayesian estimation for tacrolimus AUC0–24 h determination and dose adjustment. The Westlake interval in the entire population fell within the bioequivalence criteria for narrow therapeutic index drugs [26–28], and no significant difference was found between the mean AUC0–24 h before the switch and after the switch followed by individual dose adjustment. Despite the removal of 30/131 (23%) patients from the FAS, the study remained sufficiently powered to validate its primary objective (N > 96 patients). The higher than expected proportion of drop-outs was compensated by the lower than expected proportion of patients not meeting the inclusion criteria at V2 (hence not eligible for formulation switching). Also, although the analysis was less powered, the Westlake interval calculated from data of the PPS still fulfilled the bioequivalence criteria. These results suggest that the 1:0.7 dose conversion ratio combined with individual dose adjustment is overall adapted. Importantly, as patients’ ethnicity was not collected for regulatory reasons, and because the 1:0.7 conversion factor is not recommended for patients of African origin, we hypothesize that the patients to whom this study was proposed by their treating physician were of other origins, and mostly white Europeans.
The Westlake interval between the AUC0–24 h measured before and right after the switch also fell within the bioequivalence criteria in the entire population. This suggests that before any individual dose adjustment, the 1:0.7 dose conversion ratio is adapted, as proposed from the conversion studies [2–4]. Nevertheless, while subgroup analyses found no difference between AUC0–24 h at V2 and at V3 and V4 in KTR recipients, the Westlake interval was close to, but did not fall within, the bioequivalence criteria in LTR. This might partly be due by a lack of power in the subgroup analysis. Additionally, the correlation between the theoretical and actual doses in both contexts of the conversion and dose adjustment proposal was better in KTR than in LTR (Figure 5). More precisely, the LTR group tended to receive lower doses than those they were supposed to receive, especially for theoretical doses above 5 mg/day, while KTR overall received the theoretical doses. This lack of compliance may partly explain why the Westlake interval did not meet the bioequivalence criteria for narrow therapeutic index drugs in LTR. Still, the correlation between AUC0–24 h at V4 and at V2 in LTR who did not need and did not have dose adjustment after the conversion was poorer than that observed in KTR in the same situation (Figure 6). This observation clearly suggests that the 1:0.7 dose conversion ratio is adequate for KTR patients overall but may need to be slightly decreased and followed by dose adjustment in LTR patients. Still, the Westlake interval fell within the larger acceptance interval [0.8–1.25] recommended by the FDA for bioequivalence studies [29].
The poor correlation between AUC0–24 h at V2 and at the subsequent visits confirms the wide intra-individual variability in tacrolimus exposure [7], which was unfortunately not compensated for by individual dose adjustment. Given the short time of participation in the study, this variability cannot be attributed to long-term tacrolimus clearance variation observed mainly in patients in the late vs early period after transplantation (after M12 vs. before M1). Correlations between C0 values at V2 and the subsequent visits were even poorer. Although a decrease in the intra-individual variability of tacrolimus exposure on LCP-tacrolimus vs. IR-tacrolimus could be expected, studies in solid organ transplantation have reported comparable intra-patient variability on C0 [30, 31]. Only one study has reported a significantly lower intra-patient variability of the AUC on LCP-tacrolimus (10.9%) vs. IR-tacrolimus (14.1%) [32]. In any case, the poorer correlation between C0 values is in favour of considering the AUC0–24 h rather than C0, at least when patients are converted from IR-to LCP-tacrolimus, then at regular time points during follow-up.
The poor correlation between AUC0–24 h values before the switch and afterwards may also be due to the relatively short time period between the switch and the subsequent AUC0–24 h measurement. It was ≤3 days in 85/101 patients, so that V3 AUC0–24 h may not reflect steady-state. This may have led to imprecise or even wrong dose recommendations. Furthermore, steady state may not even have been reached at V4 in all patients, as suggested by the poor correlation between AUC0–24 h at V2 and V4 in LTR who did not need and did not have tacrolimus dose adjustment (Figure 6).
Variability may have also come from the use of DBS collected using non-volumetric devices and from the study design, where nurses collected the morning AUC at V2 while the other AUCs were collected by the patients. A comparison of AUC at V3 vs. V4, all sampled by the patients themselves, confirmed the high intra-individual variability (data not shown), dwarfing inter-operator differences as a source of variability. At the time the study was launched, analytical validation data for the measurement of tacrolimus concentrations were available only for the Whatman™ 903 protein saver cards [14, 17, 33]. In the meantime, experience has shown that the insufficient standardization of the volume of blood drops contributes to a relative imprecision of concentration measurements [22]. Another potential source of imprecision could have been the hematocrit (varying between 26.2% and 47.0% among patients at V2), as no correction of the analytical results was performed based on the hematocrit. Various patient-centered volumetric micro-sampling devices are now favored for the TDM of immunosuppressants [15, 16, 22, 34].
Twenty-two patients (17%) were withdrawn from the FAS because of unexploitable AUCs, mostly due to non-compliance with sampling times or poor quality of the DBS samples. Yet, training and a user manual had been provided to the healthcare teams and patients. This suggests that using home-based collection of microsamples requires may require even more training for certain patients, in order for them to understand the importance of respecting the sampling schedule, rigorously collect sampling information, and proceed to proper sample collection.
Interestingly, significantly lower exposure was observed in LTR compared to KTR. This may be related to the large C0 target window at inclusion, allowing liver transplant physicians to target lower C0 than kidney transplant doctors. This hypothesis is confirmed by the lower daily doses received by LTR compared to KTR (Table 2; p < 0.001). As the individual AUC0–24 h at V2 was used as a target for LCP-tacrolimus dose adjustment after V3, the lower exposure in LTR compared to KTR was carried forward throughout the study. Of note, no AUC target has been validated so far for either kidney or liver transplant patients in late periods after transplantation; the only proposed AUC0–12 h target of 150 h.μg/L [7], was derived from a study performed in 100 kidney transplant patients in the early post-transplantation period [35].
The ENVARSWITCH study used an original approach, where the Westlake interval served to compare the mean exposure obtained with the twice daily IR-tacrolimus vs the once daily LCP-tacrolimus formulation at a 0.7 dose ratio and after dose adjustment. The Westlake interval is generally used in bioavailability studies comparing generic to reference formulations, or newer to reference formulations of brand name drugs for instance. The results obtained here allow for the conclusion that LCP-tacrolimus and IR-tacrolimus had bioequivalent AUCs (since Cmax and Tmax were not studied), despite the above-mentioned sources of intra-individual variability. This is consistent with previous studies showing that respecting the 1:0.7 dose ratio obviated the need for dose adjustment in the majority of patients [30]. This means that the IR-tacrolimus to LCP-tacrolimus 1:0.7 conversion dose ratio is appropriate on average, in particular in KTR, but may deserve to be refined in LTR. We calculated that the dose ratio that would zero-in the Westlake interval within the acceptance limits for LTR should be 5% lower, i.e., 1:0.665. However, given the small difference and the impossibility of giving each patient a very precise dose, this option was not considered. The best recommendation would therefore be that tacrolimus exposure should be closely monitored in LTR, preferably based on the AUC0–24 h, in order to adjust their dose individually, i.e., to compensate for the largest individual exposure differences.
Finally, a relatively low incidence of adverse events was reported in the ENVARSWITCH study. This is related to the short duration of patient participation in the study, especially while on IR-tacrolimus (mean of 6 days between inclusion at V1 and the switch to LCP-tacrolimus).
In conclusion, while the design of the ENVARSWITCH study does not allow comparing therapeutic drug monitoring strategies (AUC or C0 monitoring from venous blood or DBS samples), its results suggest that the combination of DBS and Bayesian estimation for tacrolimus dose adjustment elicits reaching rapidly appropriate exposure to tacrolimus after the switch from IR-tacrolimus to LCP-tacrolimus. The use of volumetric microsampling devices should further improve the reliability of AUC0–24 h estimation and individual dose adjustment.
Statements
Data availability statement
The raw data supporting the conclusion of this article will be made available by the authors, without undue reservation.
Ethics statement
The studies involving human participants were reviewed and approved by Comité de Protection des Personnes (ref. CPP16-022/2016-001014-22) and French National Agency for Medicines and Health Products (ref. 160372A-11). The patients/participants provided their written informed consent to participate in this study.
Author contributions
CMo, J-BW, SC, and PMa participated in research design, the writing of the paper, the performance of the research, and data analysis. All authors contributed to the article and approved the submitted version.
Funding
The authors declare that this study received funding from Chiesi SAS France, Bois-Colombes, France. The funder was not involved in the study design, collection, analysis, interpretation of data, the writing of this article or the decision to submit it for publication.
Acknowledgments
We thank all the members of the investigating teams and patients for their active participation, Hélène Roussel for coordinating of the clinical study, Alexandre Garnier for data-management, Chloé Barny, Karine Barillier, and Aurélie Fleytoux-Mathieu for their excellent analytical contribution. We also thank Karen Poole for editing the manuscript.
Conflict of interest
CMo reports receiving lecture fees and support for participation in International Congress from Astellas. SD reports receiving lecture fees from Chiesi, Novartis, Sandoz, Intercept, Astellas, Roche, Ipsen and Abbvie and serving as a board member of Novartis and Biotest. AT reports a research grant from Astellas. MB reports financial support from Chiesi for participation in International Congress. CG has received consulting fees from Chiesi and speaker’s honoraria from Astellas. DA has received travel grant and honoraria for lectures from Chiesi. FS has received speaker’s honoraria and/or research grants from Chiesi, Novartis, Astellas, Gilead, Neovii, Merck Sharp & Dohme, Pfizer and Baxter. CMa reports research grants, financial support for participation in congresses and expertise fees from Chiesi and Astellas. PMa has received speaker and consultant honoraria and/or research grants from Chiesi, Sandoz, Astellas and BMS.
The remaining authors declare that the research was conducted in the absence of any commercial or financial relationships that could be construed as a potential conflict of interest.
Abbreviations
AE, adverse event; AUC, area under the curve; BID, twice a day; C0, trough concentration; CI, confidence interval; CKD-EPI, Chronic Kidney Disease EPIdemiology collaboration; Cmax, maximal concentration after drug intake; DBS, dried blood spot; eGFR, estimated glomerular filtration rate; FAS, full analysis set; ICH, International Council for Harmonisation of Technical Requirements for Pharmaceuticals for Human Use; IR-tacrolimus, immediate-release tacrolimus; ISBA expert system, ImmunoSuppressive Bayesian dose Adjustment expert system; KTR, Kidney transplant recipient; LCP-tacrolimus, extended-release tacrolimus; LTR, Liver transplant recipient; MedDRA, Medical Dictionary for Regulatory Activities; PPS, per-protocol set; QD, once a day; RMSE, root mean square error; SCr, serum creatinine; SD, standard deviation; TDM, therapeutic drug monitoring; V, visit.
References
1.
WoillardJBDebordJMonchaudCSaint-MarcouxFMarquetP. Population Pharmacokinetics and Bayesian Estimators for Refined Dose Adjustment of a New Tacrolimus Formulation in Kidney and Liver Transplant Patients. Clin Pharmacokinet (2017) 56(12):1491–8. 10.1007/s40262-017-0533-5
2.
GaberAOAllowayRRBodziakKKaplanBBunnapradistS. Conversion from Twice-Daily Tacrolimus Capsules to Once-Daily Extended-Release Tacrolimus (LCPT): a Phase 2 Trial of Stable Renal Transplant Recipients. Transplantation (2013) 96(2):191–7. 10.1097/TP.0b013e3182962cc1
3.
BunnapradistSCiechanowskiKWest-ThielkePMulgaonkarSRostaingLVasudevBet alConversion from Twice-Daily Tacrolimus to Once-Daily Extended Release Tacrolimus (LCPT): the Phase III Randomized MELT Trial. Am J Transpl (2013) 13(3):760–9. 10.1111/ajt.12035
4.
AllowayRREckhoffDEWashburnWKTepermanLW. Conversion from Twice Daily Tacrolimus Capsules to once Daily Extended-Release Tacrolimus (LCP-Tacro): Phase 2 Trial of Stable Liver Transplant Recipients. Liver Transpl (2014) 20(5):564–75. 10.1002/lt.23844
5.
BuddeKBunnapradistSGrinyoJMCiechanowskiKDennyJESilvaHTet alNovel Once-Daily Extended-Release Tacrolimus (LCPT) versus Twice-Daily Tacrolimus in De Novo Kidney Transplants: One-Year Results of Phase III, Double-Blind, Randomized Trial. Am J Transpl (2014) 14(12):2796–806. 10.1111/ajt.12955
6.
CaillardSMoulinBBuronFMariatCAudardVGrimbertPet alAdvagraf(®), a Once-Daily Prolonged Release Tacrolimus Formulation, in Kidney Transplantation: Literature Review and Guidelines from a Panel of Experts. Transpl Int (2016) 29(8):860–9. 10.1111/tri.12674
7.
BrunetMvan GelderTÅsbergAHaufroidVHesselinkDALangmanLet alTherapeutic Drug Monitoring of Tacrolimus-Personalized Therapy: Second Consensus Report. Ther Drug Monit (2019) 41(3):261–307. 10.1097/FTD.0000000000000640
8.
RiffCDebordJMonchaudCMarquetPWoillardJB. Population Pharmacokinetic Model and Bayesian Estimator for 2 Tacrolimus Formulations in Adult Liver Transplant Patients. Br J Clin Pharmacol (2019) 85(8):1740–50. 10.1111/bcp.13960
9.
BenkaliKRostaingLPremaudAWoillardJBSaint-MarcouxFUrienSet alPopulation Pharmacokinetics and Bayesian Estimation of Tacrolimus Exposure in Renal Transplant Recipients on a New Once-Daily Formulation. Clin Pharmacokinet (2010) 49(10):683–92. 10.2165/11535950-000000000-00000
10.
WoillardJBde WinterBCMKamarNMarquetPRostaingLRousseauA. Population Pharmacokinetic Model and Bayesian Estimator for Two Tacrolimus Formulations-Ttwice Daily Prograf and once Daily Advagraf. Br J Clin Pharmacol (2011) 71(3):391–402. 10.1111/j.1365-2125.2010.03837.x
11.
Saint-MarcouxFDebordJUndreNRousseauAMarquetP. Pharmacokinetic Modeling and Development of Bayesian Estimators in Kidney Transplant Patients Receiving the Tacrolimus Once-Daily Formulation. Ther Drug Monit (2010) 32(2):129–35. 10.1097/FTD.0b013e3181cc70db
12.
MonchaudCde WinterBCKnoopCEstenneMReynaud-GaubertMPisonCet alPopulation Pharmacokinetic Modelling and Design of a Bayesian Estimator for Therapeutic Drug Monitoring of Tacrolimus in Lung Transplantation. Clin Pharmacokinet (2012) 51(3):175–86. 10.2165/11594760-000000000-00000
13.
MarquetPBeduAMonchaudCSaint-MarcouxFRérolleJPEtienneIet alPharmacokinetic Therapeutic Drug Monitoring of Advagraf in More Than 500 Adult Renal Transplant Patients, Using an Expert System Online. Ther Drug Monit (2018) 40(3):285–91. 10.1097/FTD.0000000000000503
14.
WilhelmAJden BurgerJCGSwartEL. Therapeutic Drug Monitoring by Dried Blood Spot: Progress to Date and Future Directions. Clin Pharmacokinet (2014) 53(11):961–73. 10.1007/s40262-014-0177-7
15.
FreemanJDRosmanLMRatcliffJDStricklandPTGrahamDRSilbergeldEK. State of the Science in Dried Blood Spots. Clin Chem (2018) 64(4):656–79. 10.1373/clinchem.2017.275966
16.
VeenhofHvan BovenJFMvan der VoortABergerSPBakkerSJLTouwDJ. Effects, Costs and Implementation of Monitoring Kidney Transplant Patients’ Tacrolimus Levels with Dried Blood Spot Sampling: A Randomized Controlled Hybrid Implementation Trial. Br J Clin Pharmacol (2020) 86(7):1357–66. 10.1111/bcp.14249
17.
WebbNJARobertsDPreziosiRKeevilBG. Fingerprick Blood Samples Can Be Used to Accurately Measure Tacrolimus Levels by Tandem Mass Spectrometry. Pediatr Transpl (2005) 9(6):729–33. 10.1111/j.1399-3046.2005.00367.x
18.
ZwartTCGokoelSRMvan der BoogPJMde FijterJWKweekelDMSwenJJet alTherapeutic Drug Monitoring of Tacrolimus and Mycophenolic Acid in Outpatient Renal Transplant Recipients Using a Volumetric Dried Blood Spot Sampling Device. Br J Clin Pharmacol (2018) 84(12):2889–902. 10.1111/bcp.13755
19.
CheungCYvan der HeijdenJHoogtandersKChristiaansMLiuYLChanYHet alDried Blood Spot Measurement: Application in Tacrolimus Monitoring Using Limited Sampling Strategy and Abbreviated AUC Estimation. Transpl Int (2008) 21(2):140–5. 10.1111/j.1432-2277.2007.00584.x
20.
van BoekelGa. JDondersARTHoogtandersKEJHavenithTRAHilbrandsLBAarnoutseRE. Limited Sampling Strategy for Prolonged-Release Tacrolimus in Renal Transplant Patients by Use of the Dried Blood Spot Technique. Eur J Clin Pharmacol (2015) 71(7):811–6. 10.1007/s00228-015-1863-6
21.
MonchaudCWoillardJBTafziNMicallefLDebette-GratienMRerolleJPet alTherapeutic Drug Monitoring of Tacrolimus Using Dried Blood Spots: Preliminary Report of the ENVARSWITCH Study. In: Fundamental and Clinical Pharmacology. Hoboken, USA: WILEY (2021). p. 84. 10.1111/fcp.12671.
22.
CapiauSVeenhofHKosterRABergqvistYBoettcherMHalminghOet alOfficial International Association for Therapeutic Drug Monitoring and Clinical Toxicology Guideline: Development and Validation of Dried Blood Spot-Based Methods for Therapeutic Drug Monitoring. Ther Drug Monit (2019) 41(4):409–30. 10.1097/FTD.0000000000000643
23.
LeveyASStevensLASchmidCHZhangYLCastroAF3rdFeldmanHIet alA New Equation to Estimate Glomerular Filtration Rate. Ann Intern Med (2009) 150(9):604–12. 10.7326/0003-4819-150-9-200905050-00006
24.
European Medicines Agency. Note for Guidance on Clinical Safety Data Management: Definitions and Standards for Expedited Reporting. London, United Kingdom: European Medicines Agency (1995).
25.
SchuirmannD. On Hypothesis Testing to Determine if the Mean of a normal Distribution Is Contained in a Known Interval. Biometrics (1981) 37:617.
26.
WestlakeW. Statistical Aspects of Comparative Bioavailability Trials. Biometrics (1979) 35:273–80. 10.2307/2529949
27.
WestlakeW. Response to Bioequivalence Testing: a Need to Rethink (Reader Reaction Response). Biometrics (1981) 37:591–3.
28.
European Medicines Agency. Guideline on the Investigation of Bioequivalence. London, United Kingdom: European Medicines Agency (2010).
29.
Food and Drug Administration. Statistical Approaches to Establishing Bioequivalence. Rockville, MD: Food and Drug Administration/Center for Drug Evaluation and Research (2001).
30.
BunthofKLWAl-HassanyLNakshbandiGHesselinkDAvan SchaikRHNTen DamMAGJet alA Randomized Crossover Study Comparing Different Tacrolimus Formulations to Reduce Intrapatient Variability in Tacrolimus Exposure in Kidney Transplant Recipients. Clin Transl Sci (2022) 15(4):930–41. 10.1111/cts.13206
31.
Del BelloAGaibleCLongluneNHebralALEspositoLGandiaPet alTacrolimus Intrapatient Variability after Switching from Immediate or Prolonged-Release to Extended-Release Formulation, after an Organ Transplantation. Front Pharmacol (2021) 12:602764. 10.3389/fphar.2021.602764
32.
StifftFStolkLMLUndreNvan HooffJPChristiaansMHL. Lower Variability in 24-hour Exposure during Once-Daily Compared to Twice-Daily Tacrolimus Formulation in Kidney Transplantation. Transplantation (2014) 97(7):775–80. 10.1097/01.TP.0000437561.31212.0e
33.
KosterRABotmaRGreijdanusBUgesDRAKosterinkJGWTouwDJet alThe Performance of Five Different Dried Blood Spot Cards for the Analysis of Six Immunosuppressants. Bioanalysis (2015) 7(10):1225–35. 10.4155/bio.15.63
34.
UytfangheKVHeughebaertLStoveCP. Self-sampling at home Using Volumetric Absorptive Microsampling: Coupling Analytical Evaluation to Volunteers’ Perception in the Context of a Large Scale Study. Clin Chem Lab Med (2021) 59(5):e185–e187. 10.1515/cclm-2020-1180
35.
KuypersDRJClaesKEvenepoelPMaesBVanrenterghemY. Clinical Efficacy and Toxicity Profile of Tacrolimus and Mycophenolic Acid in Relation to Combined Long-Term Pharmacokinetics in De Novo Renal Allograft Recipients. Clin Pharmacol Ther (2004) 75(5):434–47. 10.1016/j.clpt.2003.12.009
Summary
Keywords
kidney transplantation, liver transplantation, LCP-tacrolimus, AUC monitoring, dried blood spots, conversion, therapeutic drug monitoring, dose individualization
Citation
Monchaud C, Woillard J-B, Crépin S, Tafzi N, Micallef L, Rerolle J-P, Dharancy S, Conti F, Choukroun G, Thierry A, Buchler M, Salamé E, Garrouste C, Duvoux C, Colosio C, Merville P, Anglicheau D, Etienne I, Saliba F, Mariat C, Debette-Gratien M and Marquet P (2023) Tacrolimus Exposure Before and After a Switch From Twice-Daily Immediate-Release to Once-Daily Prolonged Release Tacrolimus: The ENVARSWITCH Study. Transpl Int 36:11366. doi: 10.3389/ti.2023.11366
Received
15 March 2023
Accepted
06 July 2023
Published
01 August 2023
Volume
36 - 2023
Updates
Copyright
© 2023 Monchaud, Woillard, Crépin, Tafzi, Micallef, Rerolle, Dharancy, Conti, Choukroun, Thierry, Buchler, Salamé, Garrouste, Duvoux, Colosio, Merville, Anglicheau, Etienne, Saliba, Mariat, Debette-Gratien and Marquet.
This is an open-access article distributed under the terms of the Creative Commons Attribution License (CC BY). The use, distribution or reproduction in other forums is permitted, provided the original author(s) and the copyright owner(s) are credited and that the original publication in this journal is cited, in accordance with accepted academic practice. No use, distribution or reproduction is permitted which does not comply with these terms.
*Correspondence: Caroline Monchaud, caroline.monchaud@inserm.fr
Disclaimer
All claims expressed in this article are solely those of the authors and do not necessarily represent those of their affiliated organizations, or those of the publisher, the editors and the reviewers. Any product that may be evaluated in this article or claim that may be made by its manufacturer is not guaranteed or endorsed by the publisher.